
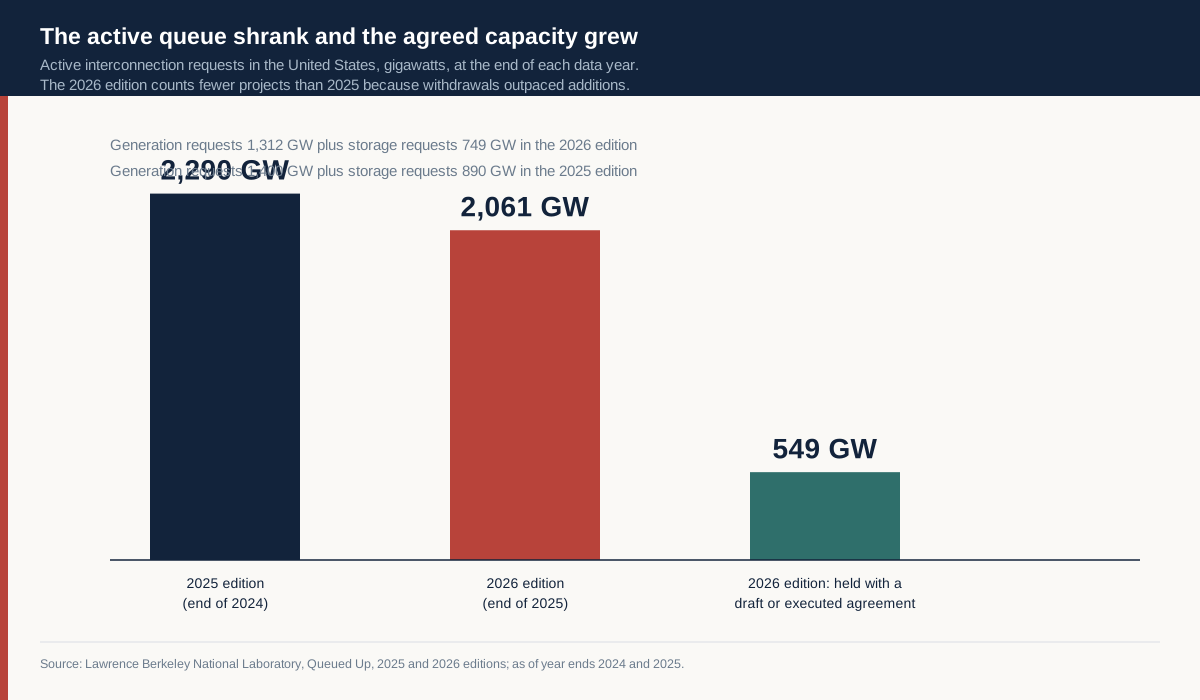
The number that circulated through the electricity industry this spring was 2,061 gigawatts, and it was read as a promise. That is the combined capacity of active generation and storage requests in American interconnection queues at the end of 2025, according to the 2026 edition of Lawrence Berkeley National Laboratory's Queued Up study, spread across about 8,200 projects. Against a national peak load that the same year's data implies is somewhere near 832 gigawatts, the queue holds two and a half times the capacity of the entire country at its busiest hour.
It is not a pipeline. A pipeline is a set of assets with a schedule. The queue is a set of applications, each of which pays a deposit and a study fee for the right to be examined in order, and most of which are withdrawn before anything is built. Thirteen percent of the capacity that requested interconnection between 2000 and 2020 had reached commercial operation by the end of 2025, with about 75 percent withdrawn and 10 percent still active. Read as a delivery schedule, that record is a catastrophe. Read as a portfolio, it is a description of how developers buy information about the grid at the only place that sells it.
The useful question about 2026 is therefore not how much capacity is queued. It is what the queue charges for the one input that a data centre cannot buy on the futures market, which is calendar time, and who ends up holding the bill when the load arrives before the supply does.
What the queue counts and what it cannot
The Queued Up series counts requests for interconnection at the transmission level: proposed generators and storage projects that have asked a regional grid operator or utility for permission to connect, and that have not yet been built, rejected or withdrawn. It is a census of intentions with money attached, and its authors are careful about the distinction. A project in the queue is not a project under construction, and the study's own language treats the queue as a set of requests rather than a supply forecast.
Two features of the 2026 edition matter more than the headline. The first is that the queue shrank. At the end of 2024 the comparable figure was about 2,290 gigawatts across roughly 10,300 projects, split into 1,400 gigawatts of generation and 890 gigawatts of storage. Over the following year about 2,100 projects left the queue and fewer arrived, leaving 2,061 gigawatts. Withdrawals were larger than additions for the first time in the series, which is what a queue looks like when the cost of holding a position rises faster than the value of the option.
The second is that the share of the queue with an agreement rose sharply. In the 2025 edition, 408 gigawatts had reached a draft or executed interconnection agreement without reaching commercial operation. In the 2026 edition that figure is 549 gigawatts, an increase of 141 gigawatts in a year in which the total queue fell by 229 gigawatts. The agreed share went from about 18 percent to about 27 percent. The queue is getting smaller and more serious at the same time, which is a different diagnosis from the one the aggregate number invites.
None of this tells a reader whether the grid will have enough power in 2029. It tells them something narrower and more useful: that the queue is a market with a clearing behaviour, that its participants hold multiple positions, and that the price of a position has been rising.
The arithmetic of a thirteen percent completion rate
Take the completion rate seriously and the queue stops looking like a supply of projects. If 13 percent of requested capacity reaches operation, the expected delivery from 2,061 gigawatts of active requests is about 268 gigawatts. That is a little under a third of implied national peak load, spread over the regions in which those requests sit, and delivered on a schedule whose median, for the cohort that reached operation in 2025, was 61 months.
The number is a historical average across a cohort, not a forecast for today's queue, and it should be read that way. The 2000 to 2020 cohort includes years when gas plants cleared quickly and years when wind projects in congested areas did not, and the mix of technologies now in the queue is different from the mix then. But the direction of the arithmetic is robust: a queue of this size, converting at the rate the record shows, produces capacity measured in the low hundreds of gigawatts, not in the thousands.
The 13 percent figure also explains the queue's most puzzling feature, which is its redundancy. A developer who wants to build 500 megawatts in a region where interconnection is uncertain does not queue 500 megawatts. It queues several sites, pays the study deposits, and keeps the ones that clear. The withdrawal rate is not waste in that reading. It is the cost of finding out which site the grid can accept, and the studies are the instrument that produces the information.
That has an awkward implication for anyone waiting on the queue to deliver. The studies are a shared resource. Every request that enters the cluster study process adds to the work the operator must do before any project in that cluster can be approved, which means the queue's length is partly a function of its own size. A system that clears applications in clusters charges every applicant for the ambiguity created by the others, and the applicants respond by filing more of them.
The agreed share is where the signal lives
The move from 408 to 549 gigawatts of agreed capacity is the most informative change in the 2026 data, because an interconnection agreement is the point at which an application becomes a commitment with engineering behind it. It means the network upgrades have been specified, the cost allocation has been settled, and the developer has accepted both.
That transition is also where the schedule risk migrates. A project with an executed agreement is no longer waiting to learn whether it can connect. It is waiting for equipment, for permits, for a construction crew and for a market price that justifies the capital. The queue's delay has been converted into a different delay, and the different delay has its own published numbers, which are worse in one respect and better in another.
Worse, because the equipment lead times are measured in years and are quoted as ranges rather than medians. Better, because once a project holds an agreement it can order equipment, sign a power purchase agreement and finance, and those steps run in parallel rather than in sequence. The queue's 61 months is a serial wait. The post-agreement phase is a concurrent one, which is why a project that clears the queue at month 61 can still energise at month 80 rather than month 100.
What the capacity auction is pricing
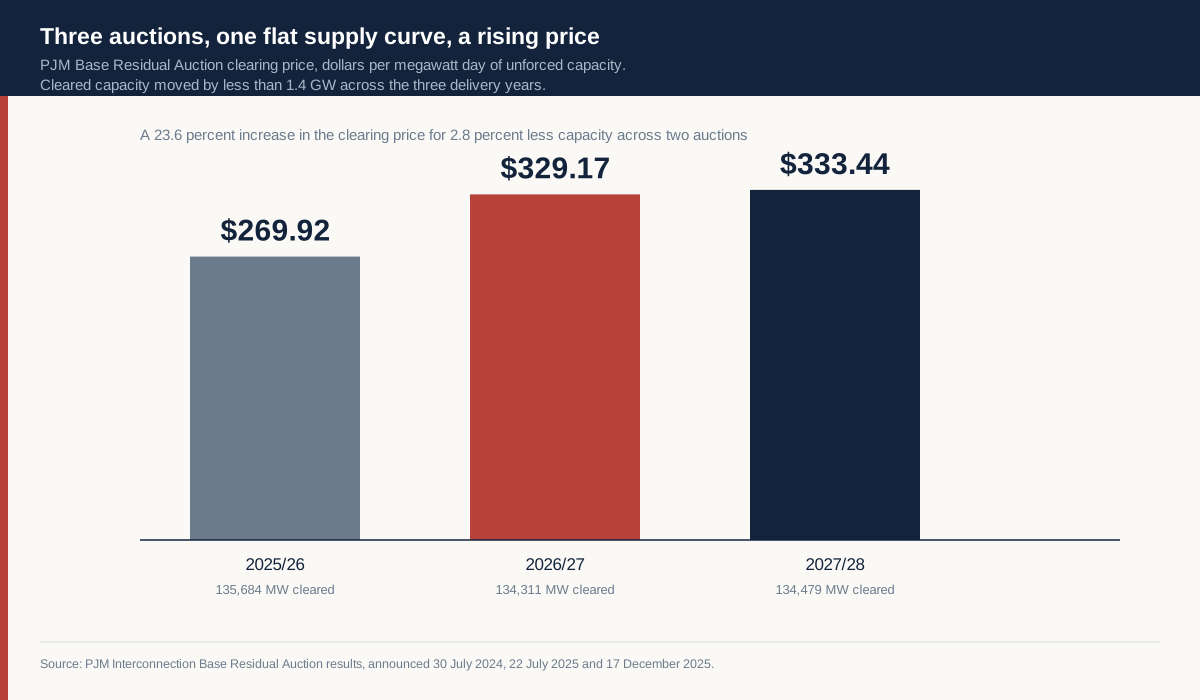
PJM's Base Residual Auctions are the cleanest public price for the thing a data centre needs, which is firm capacity at a moment of system stress. The 2025/26 auction cleared at 269.92 dollars per megawatt day for most of the footprint and procured 135,684 megawatts. The 2026/27 auction cleared at 329.17 dollars and procured 134,311 megawatts. The 2027/28 auction cleared at 333.44 dollars and procured 134,479 megawatts.
The striking feature is not the level. It is the combination: a 23.5 percent increase in the clearing price across two auctions, against a 0.9 percent decline in the capacity procured. Supply did not shrink much and price rose a great deal, which is what a market does when the demand curve shifts outward and the supply curve is close to vertical in the short run. New capacity cannot be built inside an auction cycle, so the auction clears against the existing fleet and the price does the work of allocating scarcity.
The auction is also the mechanism through which the load side of the same story becomes visible. A large load that signs a supply agreement takes on a capacity obligation, and that obligation is priced at whatever the auction clears. If the 183 gigawatts of US data centre capacity that Wood Mackenzie counted as backed by signed construction or electricity supply agreements at the end of 2025 were all carrying a capacity obligation at the 2027/28 clearing price, the annual bill would be about 22.3 billion dollars, calculated as 183,000 megawatts multiplied by 333.44 dollars per megawatt day and 365 days.
That figure is an arithmetic illustration rather than a forecast. Not all of that load sits in PJM, not all of it clears at the PJM price, and much of it is contracted bilaterally or served behind the meter. But the order of magnitude is the point. The capacity market is now pricing a demand curve that did not exist in the auctions of the previous decade, and the price is being set by a supply curve that the queue has not yet added to.
The load can be built before the generation
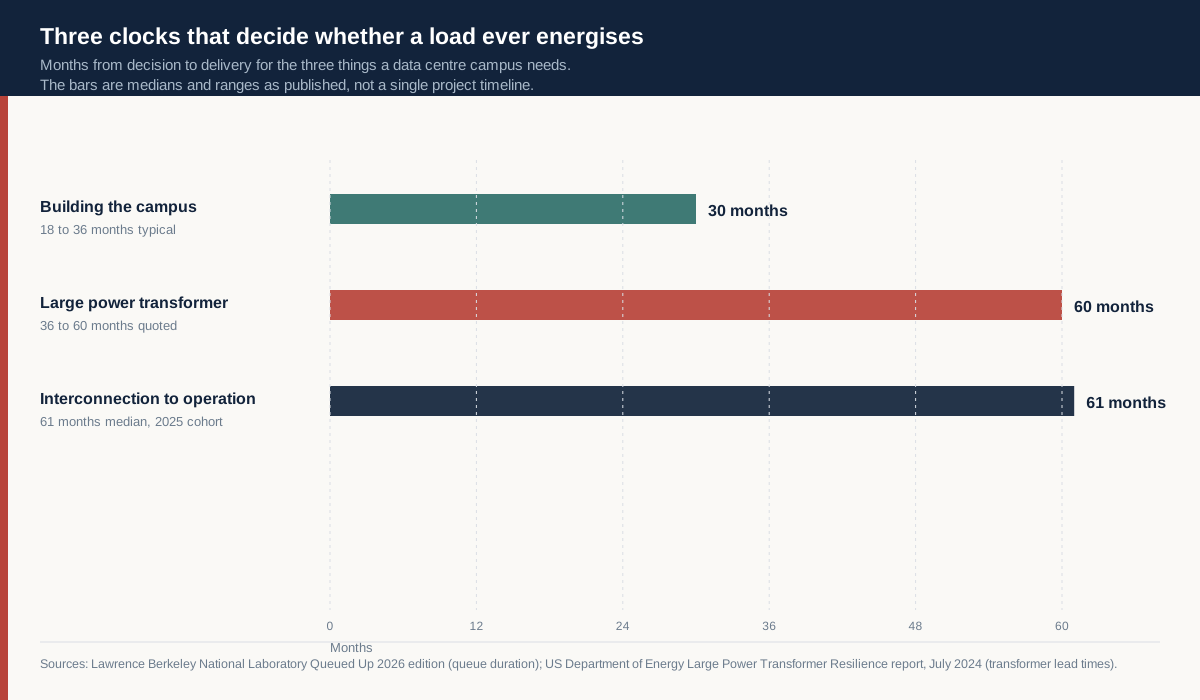
The most consequential number in the whole set is a comparison rather than a level. A data centre campus takes somewhere between 18 and 36 months to design, permit and build at scale. An interconnection request takes a median of 61 months to reach operation for the cohort that got there. The load can therefore be standing, cooled and full of servers between two and four years before the generation it was supposed to be matched with can energise.
That gap is the reason co-location arrangements have moved from an oddity to a standard instrument. A campus that connects directly to an existing plant, or that sits behind a substation with available headroom, is buying capacity that has already cleared the queue. The arrangement converts an interconnection wait into a commercial negotiation, and it explains why so much of the recent contracting has been with owners of existing assets rather than with developers of new ones.
The gap also explains why the queue's aggregate oversubscription does not translate into comfort. The queue holds 2,061 gigawatts, but it holds them in specific places, and the places where data centre load is concentrating are not evenly distributed across the country. A region with a large queue and no transmission capacity to deliver it is not a supply of power to a campus that needs it next year. The relevant measure is the queue in the load's own balancing authority, and the published aggregate hides that entirely.
The transformer is the second clock
The Department of Energy's 2024 report on large power transformer resilience put commonly quoted lead times at 36 months, with maximums reaching 60 months. The Government Accountability Office reported in August 2023 that utilities described units costing up to 10 million dollars each, with transport alone running into hundreds of thousands of dollars. Those are the numbers for the single largest and slowest component in the chain between a cleared interconnection agreement and an energised campus.
The interaction between the two clocks is what most project schedules get wrong. A developer that waits for its interconnection agreement before ordering transformers adds the transformer lead time to the queue time rather than overlapping them. A developer that orders early takes on the risk that the agreement is delayed or conditioned in a way that changes the specification. The first approach produces a project that energises around month 97. The second produces a project that energises around month 70, with a balance sheet exposure that has to be financed.
That is a real cost, and it is not visible in any of the published statistics. It shows up as working capital, as cancellation provisions in supply contracts, and as the premium a developer is willing to pay for a slot in a manufacturer's order book. The transformer market has become a queue in its own right, with its own allocation mechanism, and the price of a position in it is paid years before the asset exists.
How much generation the forecast actually requires
The Department of Energy reported in December 2024 that data centres used 176 terawatt hours of American electricity in 2023, 4.4 percent of the total, and that the range for 2028 ran from 325 to 580 terawatt hours, or 6.7 to 12 percent. The upper bound is more than three times the 2023 level. The lower bound is nearly double it.
Convert the range into capacity and the scale of the requirement becomes concrete. A gigawatt of capacity running at a 60 percent capacity factor produces about 5.26 terawatt hours a year; at 40 percent it produces about 3.5. Delivering the additional 149 terawatt hours implied by the low end of the range therefore requires somewhere between 28 and 43 gigawatts of new firm capacity, depending on how it runs. Delivering the additional 404 terawatt hours implied by the high end requires between 77 and 115 gigawatts.
Set those numbers against the queue. The required increment is between about 1.4 and 5.6 percent of the queued capacity, and between about 5 and 21 percent of the capacity that already holds an agreement. On the aggregate arithmetic, the queue is not short of projects relative to the forecast. It is short of the ability to convert applications into energised plants quickly enough in the places where the load is appearing.
That conclusion cuts against the way the queue is usually described, and it is worth stating plainly because it changes what a policy response should do. If the problem were volume, the answer would be more applications. If the problem is conversion speed and location, the answer is process design, equipment supply and transmission capacity in specific corridors, none of which a developer can fix by filing more requests.
Who holds the bill for the wait
The cost of the queue does not disappear while the queue is being worked through. It is transferred, and the transfer has a direction that is worth tracing.
The first recipient is the owner of existing capacity. Every year that new supply cannot clear the queue, the existing fleet earns a scarcity rent that it would not earn in a market with adequate supply. The PJM price path from 269.92 to 333.44 dollars per megawatt day across two auctions, on a capacity base that barely moved, is a direct measure of that rent. It is paid by load-serving entities and, through them, by the customers those entities serve.
The second recipient is the equipment manufacturer. A 36 to 60 month lead time on a transformer is a seller's market, and the premium for early delivery is a transfer from the project to the supplier. That premium is not published, which means it does not appear in any of the statistics that describe the buildout, and it is one reason the reported cost of new capacity understates the cost of new capacity delivered on time.
The third is the queue itself, in the form of study fees and deposits. Those are small relative to the capital cost of a plant, but they are paid years before any revenue and they are sunk if the project withdraws. For a developer holding several positions, the study costs are the price of the information that decides which position to keep.
The direction of these transfers matters because it determines who has an incentive to fix the constraint. The existing fleet has no incentive to speed up new entry. The equipment supplier has an incentive to lengthen the queue. Only the load, which pays the rent and waits for the campus, has an incentive to compress the schedule, and the load is the newest and least organised participant in the market.
The four things a queue position buys
A position in the queue is not a single right. It is a bundle, and each element of the bundle has a different value to the holder and a different cost to everyone else.
What an applicant actually buys with the deposit is information. Entering a cluster study buys an engineering answer to a question that cannot be answered any other way: what would it cost to connect this plant at this point on this network. That answer is expensive to produce, it is produced collectively, and it is not available for purchase anywhere else. For a developer deciding between three sites, the study is the cheapest way to eliminate two of them.
Alongside the information sits priority. The order in which projects are studied and the order in which they are granted capacity on a constrained corridor determine which plants get built first. In a network where the constraint is local, priority is worth more than the study, because it is the difference between a project that can be financed and one that cannot. This is the element that makes the queue a zero-sum contest, and it is the element that reform proposals find hardest to allocate without creating a new set of winners.
Optionality on price is the element that makes the position worth holding. A developer with a position has the right, not the obligation, to build. If power prices rise, the option is exercised; if they fall, the position is abandoned at the cost of the deposits already paid. That is a call option on the spread between the cost of new entry and the market price of energy and capacity, and like any option it becomes more valuable as volatility rises. The rise in capacity prices described above increases the value of every position in the queue, which is a reason to expect more applications rather than fewer in the next cycle.
The last element is a claim on transmission upgrades that somebody else may pay for. Network upgrades identified in a study are allocated according to rules that differ by region, and in some of them a portion of the cost is socialised across all users of the network rather than charged to the interconnecting project. A position that triggers a large upgrade can therefore confer a benefit on the region at the region's expense, and the allocation rule determines whether the applicant or the customer pays for the copper.
Read together, the four elements explain a pattern that looks irrational from outside. Developers file more requests than they intend to build because the information and the optionality are worth more than the deposits, and because priority is only obtainable by being in the study. The queue is not inflated by optimism. It is inflated by a rational response to a process that prices information and priority below their value to the applicant and above their cost to the system.
Where the socialised cost lands
The allocation question is the part of the queue that rarely appears in coverage and determines most of the distributional outcome. Two projects of identical size can impose very different costs on the network, and the rules that divide those costs between the project and the customer base are set region by region, often through stakeholder processes that few outside participants follow.
A transmission upgrade built to connect a generator is, in most regimes, at least partly the responsibility of that generator. But the upgrade remains an asset of the transmission owner, it is included in the rate base, and its cost is recovered from customers over decades. The generator's contribution is a share of the capital cost, negotiated through the study process, and the residual is recovered from load. That structure produces a predictable behaviour: projects seek locations where the upgrade requirement is small, and regions with weak networks attract fewer projects than their resources would justify, because the connection cost is higher there.
The same structure explains why the queue's geography does not match the resource's geography. The places with the best wind and solar are frequently the places with the least transmission, so the projects that would be cheapest to operate are the most expensive to connect. A queue that ranks projects by their readiness rather than by their system value will build the ones that are easy to connect, which is not the same as the ones that are worth connecting.
For a large load, the mirror image applies. A campus that requires a new substation and a transmission line pays for them, directly or through a tariff, and the cost of that connection is a fixed charge that does not fall when the campus runs below capacity. That is one reason hyperscale operators have preferred sites with existing headroom, and it is a reason the co-location arrangements described earlier have become commercially attractive: they use capacity that was already paid for.
What the load side of the ledger actually says
The queue measures supply. The load side is measured somewhere else, and the two numbers are not collected by the same institutions, which is why the public conversation about electricity adequacy so often talks past itself.
The best available national figures for data centre consumption come from the Department of Energy's 2024 report, which puts 2023 consumption at 176 terawatt hours and the 2028 range at 325 to 580. Those are energy figures, not capacity figures, and the conversion between them depends on how the load runs. A campus that runs at a 90 percent load factor needs far less capacity for the same annual energy than a campus that runs at 60 percent, and the difference between those two assumptions is larger than the difference between the low and high ends of the forecast.
The Wood Mackenzie count of 241 gigawatts of disclosed pipeline and 183 gigawatts backed by signed agreements is a third measure again: it counts capacity that operators have announced or contracted, not energy consumed and not interconnection granted. The three measures can all be correct and can all point in different directions, because they are answering different questions. A reader who treats 183 gigawatts of signed agreements as 183 gigawatts of new demand has skipped the step where a contract becomes a connection.
What can be said is that the three measures are converging on a requirement that is large relative to the increment the system has been adding, and small relative to the queue. That combination is unusual. In previous buildout cycles the constraint was the availability of projects; in this one the projects exist in surplus and the constraint is the machinery that turns them into plants.
The counter-evidence worth taking seriously
Three readings of the same data would weaken the constraint argument, and none of them can be dismissed on the record available.
The first is that the withdrawal wave is the system working. If the queue is a portfolio of options, a year in which 2,100 projects leave is a year in which the market cleared its own ambiguity, and the 141 gigawatt increase in agreed capacity is the evidence that the process is producing commitments rather than delay. On that reading, the queue's shrinkage is a sign of maturity, and 2027 will show a further concentration into fewer, better projects.
The second is that the capacity price rise is about reliability policy rather than data centre load. PJM's auction is driven by a reliability requirement that its members set, and changes to that requirement, to the treatment of imports, or to the offer floor would move the clearing price without any change in data centre demand. The observed price path is consistent with several causes, and attributing it to a single one would overstate what the auction shows.
The third is that demand forecasts of the kind the Department of Energy published are scenarios rather than commitments. The 2028 range spans a factor of 1.8 between its bounds, which is a statement about how uncertain the authors considered the projection. A buildout sized to the upper bound would be a buildout sized to a scenario, and the lower bound is satisfied by a much smaller increment than the queue already contains.
Each of these is a reason to hold the conclusion at the level the evidence supports. The queue is oversubscribed relative to need, its conversion rate is low, and the wait it imposes is longer than the construction schedule of the load that is waiting. None of that proves a shortage in 2029. It does establish that the binding constraint in the current buildout is calendar time, and that the market has begun to price it.
What the record does not settle
Two gaps in the public record are large enough to change the interpretation if they were filled. The first is that there is no published national figure for how much announced data centre load holds an executed grid interconnection agreement, as distinct from a signed construction or supply contract. The 183 gigawatt figure measures commercial agreements; the queue measures requests. The space between them is where the actual risk sits, and no agency publishes it.
The second is that the transformer data are lead time ranges rather than a time series. The Department of Energy reported what utilities said in 2023 and 2024. Whether those lead times have lengthened or shortened since, and at what price, is not in the public domain in a form that can be compared year on year. A buildout analysis that treats a 2024 quote as a 2026 fact is doing something the source does not support.
What the record does settle is narrower and more useful. The queue holds two and a half times national peak load and converts about thirteen percent of what it holds. The agreed share is rising while the total falls. The capacity market is repricing a demand curve it did not have a decade ago. And the load can be built faster than the supply it needs, which is why the next four years of American electricity will be decided less by how many projects are proposed than by how quickly a small number of them can be turned into steel, copper and energised circuits.