
Executive summary
This report measures the largest private infrastructure build-out in history against its own history, its own finances and its closest historical parallel. Its findings rest on company filings, earnings guidance and public datasets assembled and cross-checked in September 2026.
The research question. The four largest buyers of AI compute — Amazon, Microsoft, Alphabet and Meta — are spending at a scale no private companies have ever approached. How large is this boom relative to the economy, to the companies' own revenues and to the telecom bubble that remains the standard cautionary comparison? Who funds it, who supplies it, what physical systems does it depend on — and what evidence would distinguish a durable build-out from an overbuild?
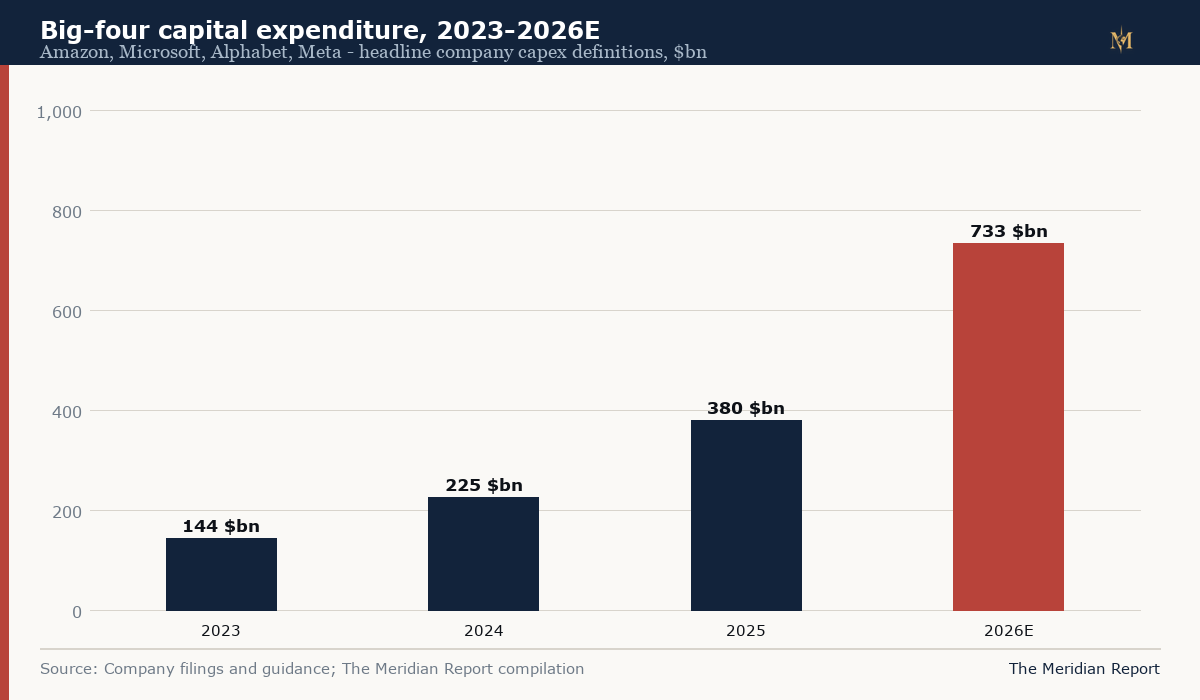
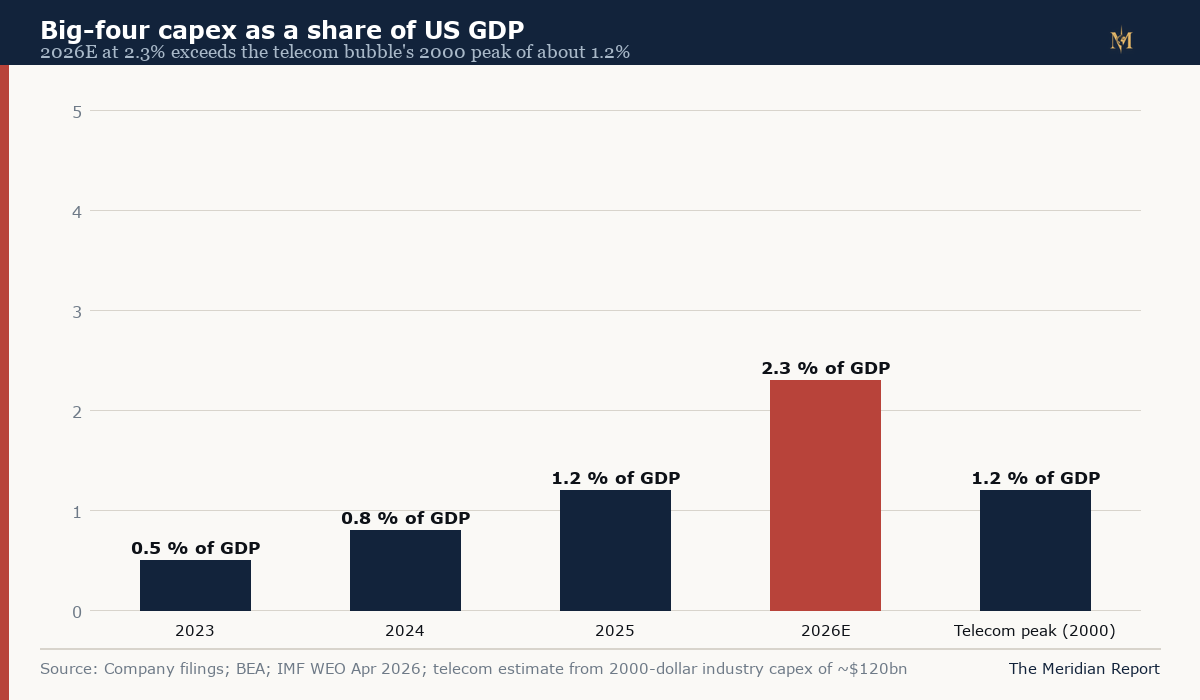
The principal finding. The big four plan $720–745 billion of capital expenditure in 2026 — call it $733 billion at the midpoints — which is approximately 2.3% of US GDP. The US telecom sector spent an estimated $120 billion in 2000, its peak year, when that was roughly 1.2% of GDP. The AI build-out is therefore running at roughly twice the telecom boom's peak intensity relative to the economy, and it is still accelerating: 2026 spending is nearly double 2025's $380 billion, which was nearly double 2024's $225 billion.
The most important supporting evidence.
- Filings compiled from the companies' own disclosures: Amazon cash capex of $48.1bn (2023) → $77.7bn (2024) → $128.3bn (2025) → ~$220bn planned (2026); Alphabet $32.3bn → $52.5bn → $91.4bn → $195–205bn; Meta $28.1bn → $39.2bn → $72.2bn → $130–145bn; Microsoft $28.1bn → $44.5bn → $64.6bn (fiscal years) → ~$175bn calendar-2026.
- Cumulative capex since January 2023 crossed $1.05 trillion in mid-2026 — a reconstruction from filings, not a company-reported figure, with definitional caveats set out in the methodology.
- The financing is shifting from internal cash to external capital: hyperscaler free cash flow has collapsed toward zero as capex outruns operating cash flow; Meta's October 2025 $27 billion Hyperion joint-venture financing with Blue Owl and its subsequent ~$30 billion private-credit raise; Oracle's borrowing against its OpenAI contracts; AI-linked corporate debt issuance of roughly $141 billion in 2025, by credit-market tallies.
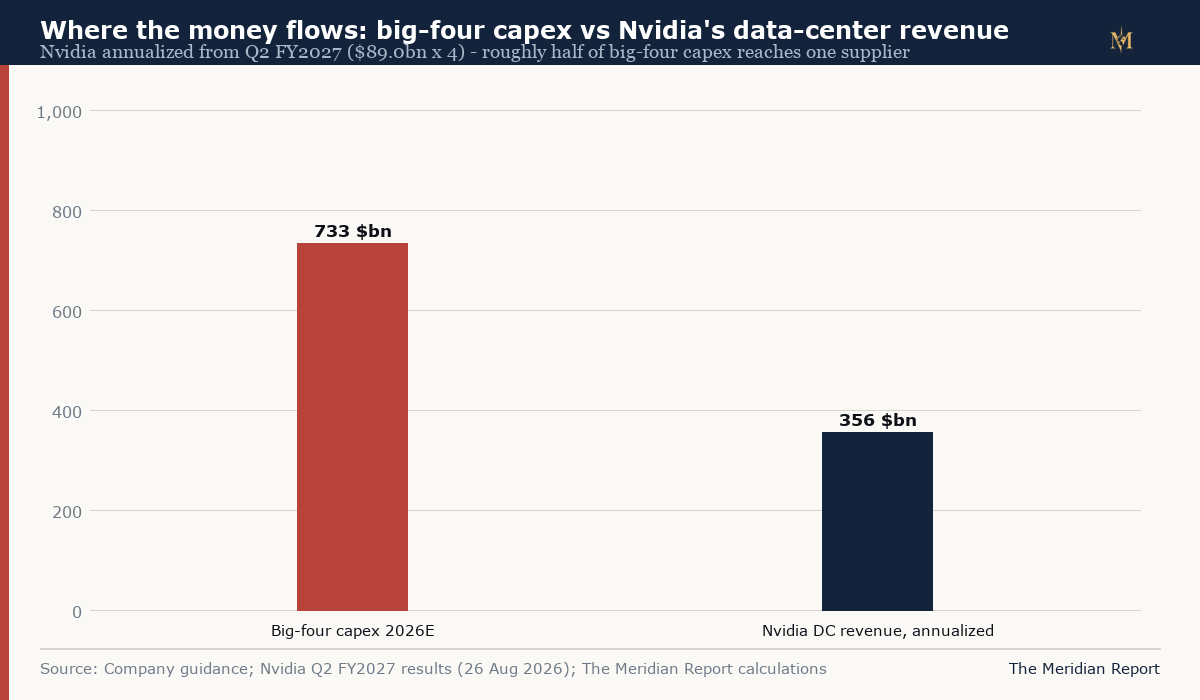
- Concentration: Nvidia's data-center revenue of $89.0 billion in the quarter ended July 2026, annualized to roughly $356 billion, equals about half of big-four capex; roughly 61% of Nvidia's revenue comes from a handful of large customers. The demand side of the boom and the supply side of the boom now depend on the same five balance sheets.
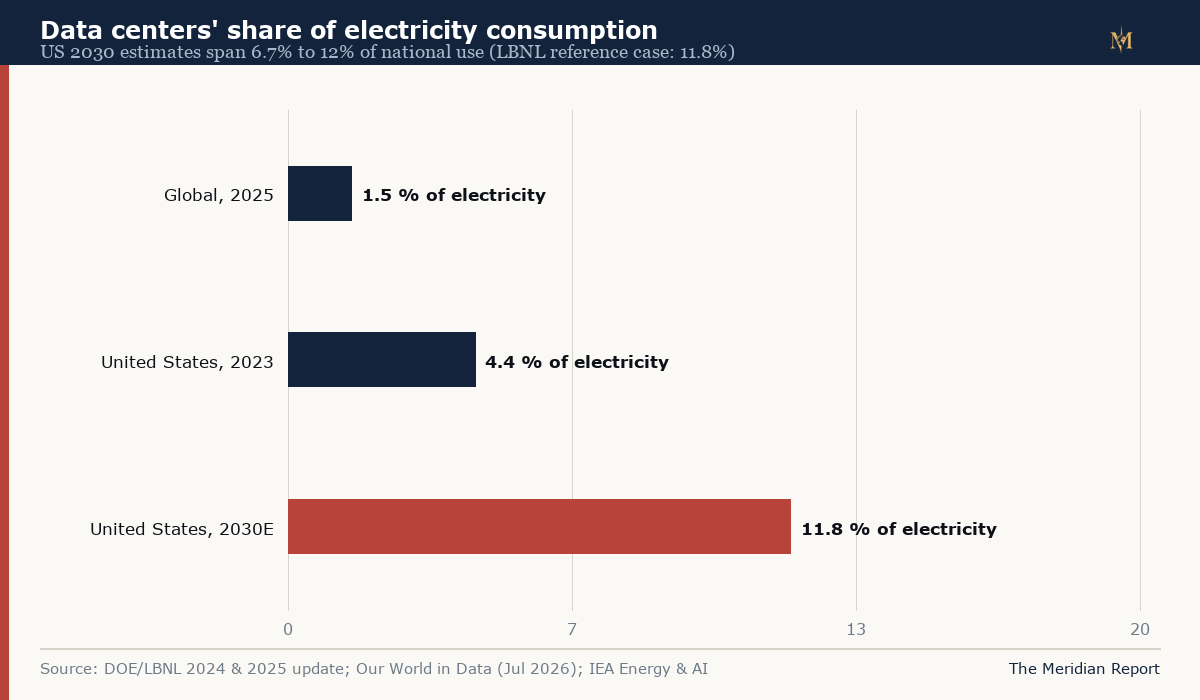
- Electricity: US data-center consumption was 4.4% of national use in 2023 and is projected by the Department of Energy at 6.7–12% by 2030 (LBNL reference case 11.8%). Power interconnection, not money, is the binding constraint on many projects.
Why it matters. If the demand materializes, this is the fastest productive-capacity expansion ever financed. If it does not, the write-down would be measured in hundreds of billions of dollars, concentrated in a handful of balance sheets that also anchor American equity indices, pension savings and the corporate bond market. Either way, the boom is already large enough to move national statistics: its spending is visible in US GDP growth, its electricity demand in regional grids, and its borrowing in credit markets.
Limitations. No company discloses "AI-only" capex; the figures here follow each company's headline definition, which differ in lease treatment (methodology below). Cumulative and GDP-relative figures are reconstructions with stated error bars. Forward-looking statements are company guidance, not forecasts by this publication, and scenario outcomes in Section 9 are conditional descriptions, not predictions.
Key findings
-
2026 capex of $720–745 billion is nearly double 2025. The big four spent roughly $380 billion in 2025 and plan $733 billion at guidance midpoints for 2026 — a 93% increase in one year, after 68% growth in 2025 and 56% growth in 2024.
-
Relative to the economy, the boom is roughly twice the telecom bubble's peak intensity. Big-four capex equals about 2.3% of US GDP in 2026; the US telecom sector's 2000 capex peak was about 1.2% of GDP in comparable terms.
-
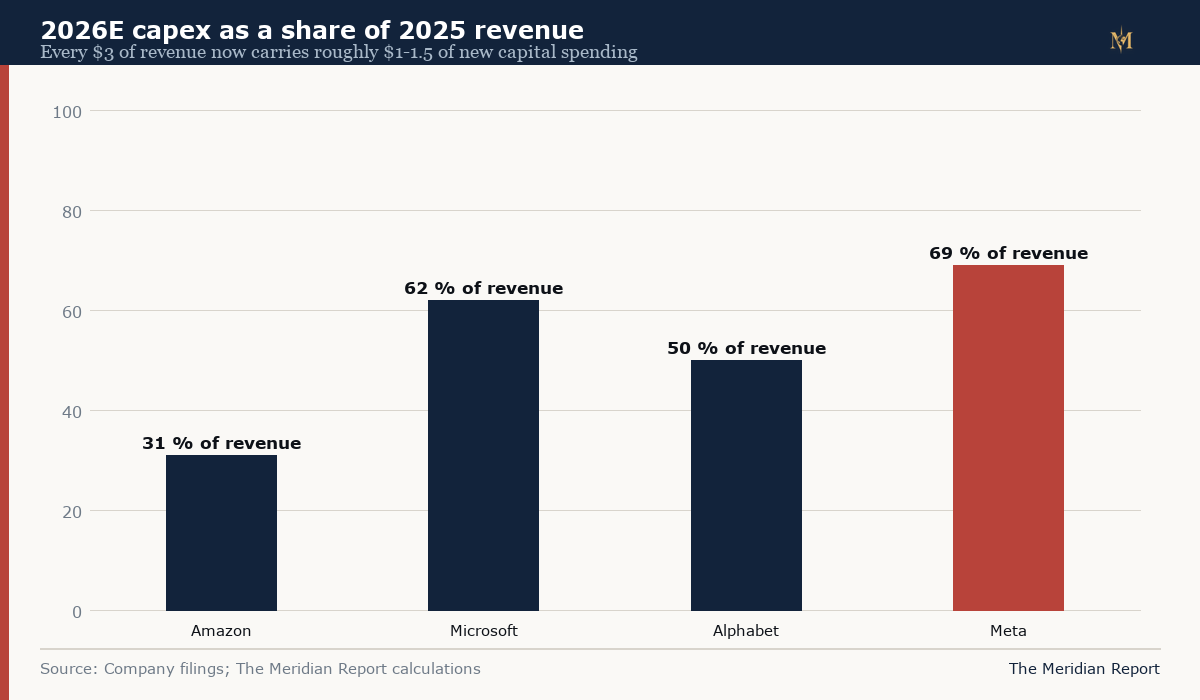
Capex is consuming the companies' cash generation. Meta's 2026 guidance equals roughly 69% of its 2025 revenue; Microsoft's about 62%; Alphabet's about 50%; Amazon's about 31%. Market tallies compiled from the builders' filings show combined quarterly free cash flow of the five large AI builders falling from roughly $61 billion in 2024 to under $5 billion by mid-2026; FactSet's July 2026 review documents the same downward trend and projects further decline.
-
The funding model is changing. The boom began as operating-cash-flow spending; it is becoming a credit-financed build-out — Meta's $27bn Blue Owl JV and ~$30bn private-credit raise, Oracle's data-center borrowing, ~$141bn of AI-linked debt issuance in 2025, and Moody's $662bn estimate of uncommenced data-center leases (113% of the five hyperscalers' adjusted debt).
-
About half of every capex dollar's equipment component flows to one vendor. Nvidia's data-center revenue annualizes to roughly $356 billion against $733 billion of total big-four capex. With roughly 61% of Nvidia revenue concentrated in a few customers, the boom's supply chain is as concentrated as its demand.
-
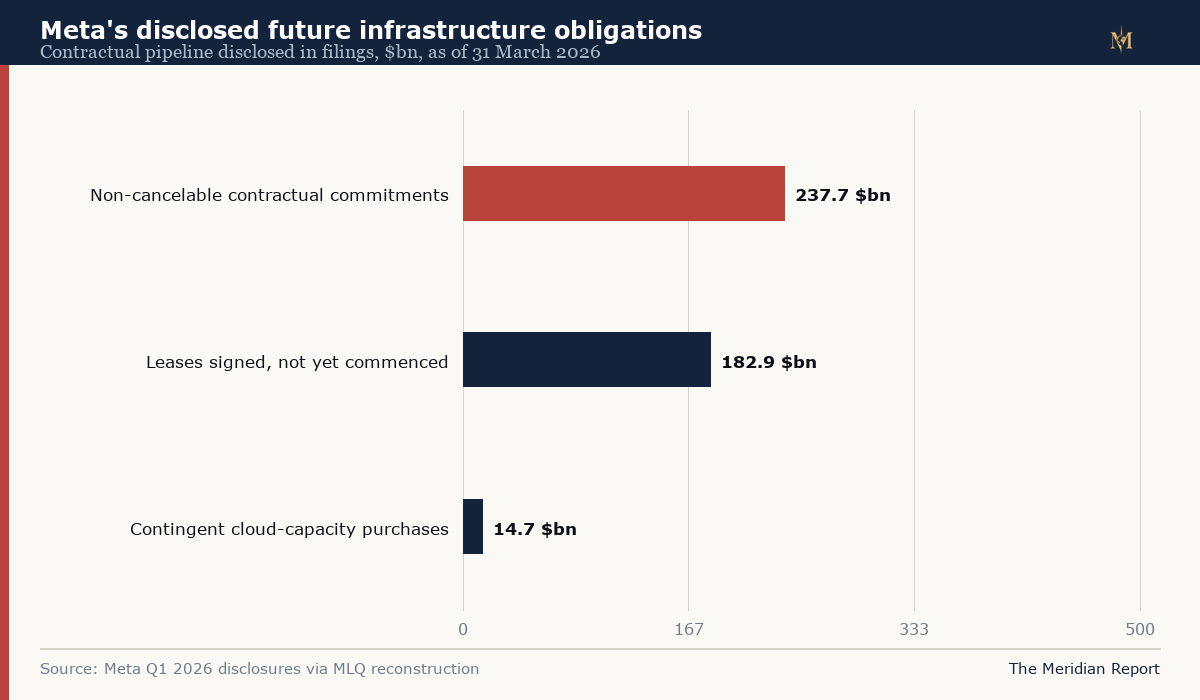
Commitments now extend far beyond spending. Meta alone discloses $237.7 billion of non-cancelable contractual commitments, $182.9 billion of signed-but-not-commenced leases and up to $14.7 billion of contingent capacity purchases (as of 31 March 2026). Moody's narrower count of uncommenced leases across five companies: $662 billion.
-
OpenAI's $1.4 trillion of planned commitments over eight years exceeds its revenue by orders of magnitude. The deals — Oracle (up to $300bn), Stargate, chipmakers — transfer construction risk to suppliers and lenders today in exchange for revenue that must materialize tomorrow. One flagship Oracle-OpenAI data-center expansion was scrapped in March 2026 after terms could not be reached, an early sign of friction in the commitment stack.
-
Electricity, not capital, is becoming the binding constraint. US data-center load was 4.4% of national electricity in 2023; DOE scenarios reach 6.7–12% by 2030. Grid interconnection queues, transformer shortages and local opposition now set the pace of the build-out in several markets — Microsoft has cited $80 billion of unfulfilled Azure orders tied partly to power constraints.
-
Backlogs show real demand — today. Google Cloud's backlog reached $514 billion by mid-2026; Azure growth remained above 30%. The debate is not whether demand exists in 2026 but whether contracted growth rates persist through the decade-long depreciation lives of the assets being built.
-
The telecom comparison is instructive but bounded. The 1996–2001 telecom boom raised roughly $1 trillion (about $500bn of it capex) and left a fiber glut so deep that prices collapsed; yet that fiber later carried the streaming and mobile internet. Its builders were unprofitable and debt-financed; today's builders are the most profitable companies in history. The debt-financed-overbuild risk rhymes; the balance-sheet starting point does not.
1. What happened: the spending record, company by company
The scale of the boom is easiest to see in the companies' own filings, assembled year by year.
Amazon. Cash capital expenditures were $48.1 billion in 2023, $77.7 billion in 2024 and $128.3 billion in 2025, with the company attributing the increase primarily to technology infrastructure supporting AWS. In February 2026 it guided to $200 billion for 2026; by mid-year the plan had risen to approximately $220 billion, which management attributed to higher component costs and AWS/AI capacity. Amazon's first-quarter 2026 free cash flow swung to an outflow of $7.6 billion as server purchases accelerated.
Alphabet. Purchases of property and equipment rose from $32.3 billion (2023) to $52.5 billion (2024) and $91.4 billion (2025). Guidance for 2026 was raised twice: to $180–190 billion in April, then to $195–205 billion after a second quarter in which the company spent $44.9 billion and disclosed a Google Cloud backlog of $514 billion. Alphabet has said roughly 60% of its capex goes to servers, with about 40% to data centers and networking.
Meta. Capex including finance-lease principal — Meta's preferred measure — ran $28.1 billion (2023), $39.2 billion (2024), $72.2 billion (2025). Guidance for 2026 has been raised repeatedly to $130–145 billion; the first half of 2026 alone recorded $50.9 billion. Meta's board approved no buybacks in recent quarters as spending absorbed cash generation.
Microsoft. On a fiscal-year basis, cash payments for property and equipment rose from about $28.1 billion (FY2023) to $44.5 billion (FY2024) and $64.6 billion (FY2025), with finance leases adding substantially more capacity in kind than in cash. Microsoft guided to roughly $190 billion of calendar-2026 capex in April; in July, after extending the useful lives of data-center buildings from 15 to 25 years, its reported capex estimate shifted to about $175 billion because more future leases classify as operating rather than finance leases. The company stated its underlying investment expectations were unchanged — an accounting illustration of why cross-company capex comparisons require care.
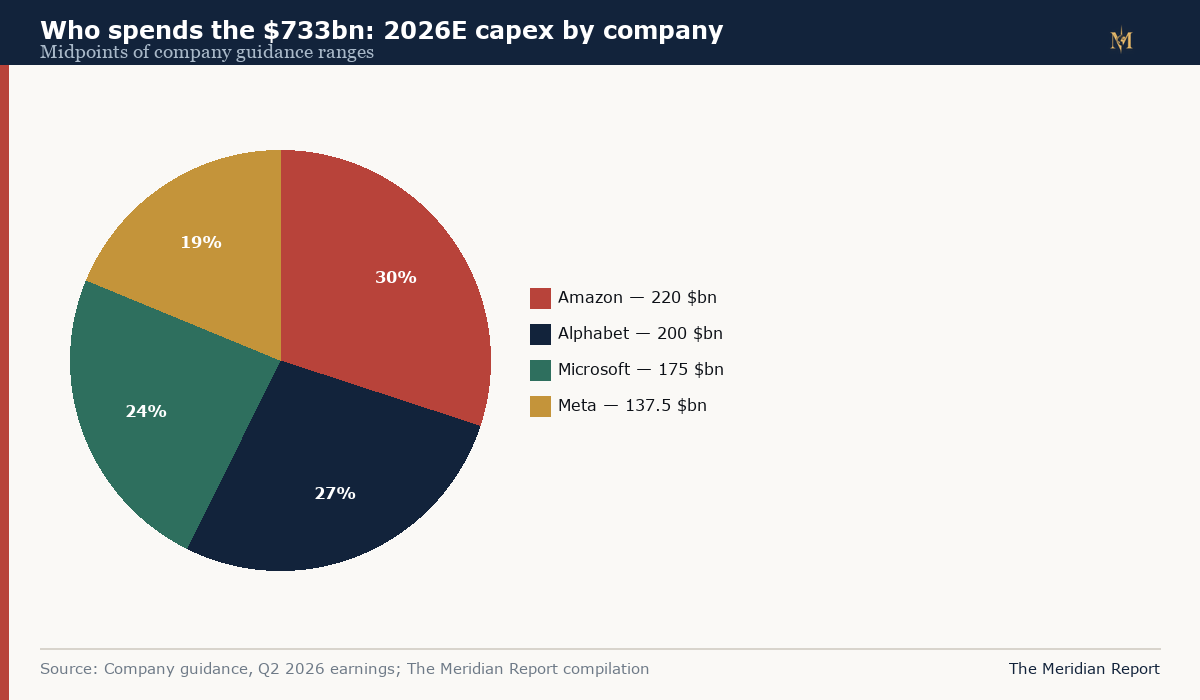
Summed at guidance midpoints, 2026 planned spending is approximately $733 billion: Amazon ~$220bn, Alphabet ~$200bn, Microsoft ~$175bn, Meta ~$137.5bn.
2. The cumulative number: $1.05 trillion in three and a half years
Adding calendar-aligned spending across the four companies produces roughly $750 billion from January 2023 through December 2025, and about $300 billion more in the first half of 2026 — a cumulative reconstruction of approximately $1.05 trillion since January 2023.
Three caveats keep this honest:
- Definitions differ. Amazon reports cash capex; Meta adds finance-lease principal; Microsoft's headline moves with lease classification. The reconstruction aligns quarters but cannot erase definitional seams.
- "Capex" is not "AI." The disclosures include conventional cloud equipment, fulfillment centers, offices and networking. No company reports an AI-only figure; estimates that attribute everything to AI overstate it, and estimates that exclude supporting infrastructure understate it.
- Leases blur the line. When a leased data center opens, years of future payments move from footnotes onto balance sheets in one quarter; Microsoft's useful-life change moved roughly $15 billion of planned spending between categories with no change in physical investment.
A chronology of the escalation
The speed of the build-out is easiest to see as a sequence. Each step below is dated and sourced; together they show how quickly the spending base rate changed.
2024. Big-four capex runs about $225 billion for the year — up 56% on 2023, itself up sharply on 2022 — as the ChatGPT-era demand shock reaches procurement budgets. Microsoft's finance-lease commencements begin visibly outrunning its cash spending, an early signal that capacity demand exceeds what conventional funding cycles anticipated.
September 2025. Oracle and OpenAI announce a cloud contract of up to $300 billion over five years, beginning in 2027 — a commitment larger than Oracle's entire annual revenue, to be delivered by capacity not yet built. OpenAI's Stargate venture turns to debt-financed chip leasing. In the same month, Meta closes the $27 billion Blue Owl financing for its Hyperion campus.
November 2025. The Financial Times tallies OpenAI's infrastructure commitments at roughly $1.4 trillion over eight years and asks how they will be funded. AI-linked corporate debt issuance reaches roughly $141 billion for 2025. Oracle shares sell off hard as investors confront the borrowing behind its OpenAI contracts.
February 2026. The year's guidance round lands as a shock: Amazon guides to $200 billion, Alphabet to $175–185 billion, Meta to roughly $115–135 billion, Microsoft signals capex growth above its fiscal-2025 total. Financial press comparisons to national economies (Fortune: the spend 'rivals Sweden's GDP') enter the mainstream.
March–April 2026. The commitment stack shows its first public friction: Oracle and OpenAI scrap plans to expand a flagship Stargate data center after terms cannot be reached. Alphabet raises guidance again (April). Meta signs roughly $24 billion of additional infrastructure contracts in April alone. The Wall Street Journal reports that syndicating Oracle's data-center debt is straining bank exposure limits.
July–August 2026. Microsoft's useful-life reclassification adjusts its reported capex to ~$175 billion with no change in physical plans. Reuters and FactSet quantify the free-cash-flow squeeze. Alphabet raises guidance a third time to $195–205 billion on a $514 billion cloud backlog; Meta narrows to $130–145 billion. The four-company total settles at $720–745 billion — roughly $85 billion above where the year's guidance began in February.
September 2026. S&P Global Market Intelligence projects more than $5 trillion of hyperscaler capex from 2026 through 2030; Goldman Sachs' June estimate for the big four alone was $5.3 trillion. The boom enters its fourth year with no guidance yet for 2027 and no sign of order moderation.
The pattern in the chronology is the escalation mechanism itself: guidance set in February is raised by April and again by August; each raise is justified by orders taken in the preceding quarter; and the financing adapts to each raise one structure at a time. Nothing in the sequence suggests a planned, one-time step-up. It is a ratchet.
3. Scale against the economy: 2.3% of GDP, and what that means
Set against an IMF-projected $32.38 trillion US economy for 2026, $733 billion of spending by four companies equals approximately 2.3% of US GDP.
Historical context gives the number weight:
- The telecom boom, the standard comparator, saw US telecom carriers spend roughly $120 billion in 2000 — about 1.2% of GDP in that year's economy. Across 1996–2001 the sector raised close to $1 trillion including debt and equity.
- The railroad manias of the 19th century and the canal boom before them were larger relative to GDP but were spread across national economies and decades, and were substantially public.
- The US interstate highway system, the largest public-works program in American history, cost about $500 billion in today's dollars spread over 35 years — under $20 billion per year in current terms, though its scale relative to federal budgets was far larger.
By the GDP-relative measure the four hyperscalers are now building, in a single year, infrastructure at roughly twice the telecom boom's peak intensity — and they plan more in 2027. Two things follow. First, the boom is macroeconomically material: at this scale, capex swings show up in national investment statistics and GDP growth arithmetic. Second, the honest comparison set is not only "other companies" but "other national infrastructure programs" — because that is the intensity class the spending now occupies.
The deeper historical baseline
Placing the boom only against telecom understates the comparison set. Economic historians generally place peak railroad investment in the 1870s–1880s and again around 1900 at several percent of GDP in the countries most affected, financed through a mix of equity, bonds and land grants — booms that delivered transformative networks and repeated investor wipeouts, sometimes in the same decade. American electric-utility construction in the late 1920s ran in the low single digits as a share of GDP before the Depression forced consolidation and regulation. Interstate highway spending, by contrast, was spread over 35 years and funded publicly, which is why its annual intensity looks modest even though its cumulative scale was vast.
Two lessons from that longer record apply directly here.
First, infrastructure booms at this intensity are rarely completed on their original financial terms. Railroads were reorganized in receivership; utilities were consolidated under regulation; fiber carriers went through bankruptcy while the fiber itself kept carrying traffic. The asset typically survives and eventually earns its keep; the capital structure that built it at peak prices frequently does not. Applied to AI: the campuses being poured in 2026 will very likely be running workloads in 2035 — the open question is which class of investor holds the paper at what price when the return math is finally written down.
Second, the demand estimate has never been the sole determinant of outcomes — the financing cadence is. The canal and railroad manias did not end because demand for transport disappeared; they ended because incremental capital was raised against extrapolated demand after the easily-served market was saturated. The AI analogue is the commitment stack: OpenAI's $1.4 trillion plan, $662 billion of uncommenced leases, Meta's $237.7 billion of non-cancelable contracts — payment schedules written against demand that is contracted but not yet observed, maturing 2027–2032.
What a 2.3%-of-GDP year does to the arithmetic of growth
The increment alone — roughly $350 billion of additional capex in 2026 versus 2025 — would, if every dollar were spent domestically, add more than a percentage point to the level of US GDP in a $32.4 trillion economy. In practice the impulse is smaller for two reasons the national accounts make visible: a substantial share of the equipment content is manufactured abroad (advanced logic and memory wafers from Taiwan and South Korea, assembled into servers domestically), and some spending lands as inventory and intermediate goods rather than final demand. The domestic footprint remains large enough that economists now explicitly list AI data-center investment among the contributors to US investment growth — and its pause among the risks to it.
4. Who funds it: from operating cash to outside capital
The boom's first phase was financed from operations. The second phase is increasingly not.
The cash-flow squeeze. Reuters reported in July 2026 that hyperscaler capex plans exceed their operating cash flow growth: operating cash flow is projected to rise by roughly $340 billion between 2025 and 2027, while capex over the same horizon rises faster. Market tallies compiled from the five builders' filings show combined quarterly free cash flow falling from about $61 billion in 2024 to under $5 billion by mid-2026. FactSet's July 2026 review documents the same trend and projects further decline; S&P Global Ratings expects the major US hyperscalers to run negative free operating cash flow into 2027.
The specific mechanisms.
- Private credit joint ventures. In October 2025, Meta closed a $27 billion financing with Blue Owl Capital for its Hyperion data-center campus — among the largest private-capital deals ever — keeping the debt off Meta's balance sheet while securing capacity. A further Meta financing of roughly $29–30 billion (a blend of bonds and private credit, led by PIMCO and JPMorgan) followed in late 2025 for additional data centers.
- Supplier financing. Oracle, having signed cloud contracts with OpenAI of up to $300 billion, has issued successive large bond deals and is using debt to build capacity for delivery starting in 2027; Wall Street syndication desks have strained against single-borrower exposure limits doing it.
- Sector-wide issuance. Roughly $141 billion of corporate debt was issued by AI-linked companies in 2025, by credit-market tallies — a record — before a heavier 2026 calendar.
- Chip-linked borrowing. OpenAI's Stargate venture and others use debt-financed chip leasing; Nvidia's financing arm and vendor-financing arrangements blur further lines between capex and credit.
The obligations already signed. Meta's filings disclose $237.7 billion of non-cancelable contractual commitments, $182.9 billion of leases signed but not yet commenced, and up to $14.7 billion of contingent cloud-capacity purchases as of 31 March 2026, plus ~$24 billion of additional infrastructure contracts signed in April. Moody's counted $662 billion of uncommenced data-center leases across the five largest builders — 113% of their adjusted debt. The widely quoted "$1.65 trillion of hidden debt" (Nikkei) mixes these categories and should be read as contractual exposure, not funded debt; the narrower, auditable numbers are large enough.
The direction of travel is the finding: the boom that began as the most conservatively financed construction program in corporate history is becoming a leveraged one, at the margin, one financing at a time.
Why the buyers accept these structures: the "why can't they just pay cash?" test
If external financing is more expensive and more fragile than operating cash, why do the strongest balance sheets in corporate history accept it? Four constraints, each independently verifiable, make the answer structural rather than imprudent.
Speed. A gigawatt-scale campus costs $10–25 billion and takes 18–36 months to build. Waiting two years to accumulate the cash from operations means entering service two years late against competitors who financed instead — and in a market where cloud backlogs measure years of committed demand, lateness is a revenue loss, not a saving. Meta's guidance nearly doubled in a year precisely because capacity lagged demand.
Balance-sheet optics and the JV invention. The Blue Owl structure matters less for its interest rate than for its accounting position: capacity secured off-balance-sheet, with Meta holding an equity interest and the special-purpose vehicle carrying the debt. Moody's and S&P both treat such arrangements as debt-like in adjusted metrics — 113% of adjusted debt in uncommenced leases is Moody's arithmetic — but ratings impacts and covenant tests differ from funded bonds. The structures exist because they let the builders get capacity today without the market pricing them as leveraged tomorrow. That is rational for the buyer; it concentrates the same risk in non-bank lenders instead.
The commitment stack forces the suppliers to finance too. Oracle cannot deliver $300 billion of OpenAI capacity from its existing cash generation; its bonds are the mirror image of its contracts. Nvidia's financing programs, chip-lease structures at Stargate, and vendor pre-payment arrangements are the same mechanism one step upstream. When the largest buyer's largest commitments exceed the buyer's revenue, the financing problem does not disappear — it migrates to whoever has the balance sheet to carry it until revenue arrives.
Depreciation arithmetic. Accelerated server depreciation (roughly 5–6 years at several builders) means each year's spend must be replaced almost immediately to hold capacity constant, before any growth. At $733 billion, a majority of the budget is replacement, not expansion — a ratchet built into the accounting. Growth capex layered on replacement capex is why spending compounds even when demand growth merely matches capacity growth.
Capacity precision: what "$733 billion" actually buys
Distinguishing capacity types sharpens the picture, because the boom's constraint differs by type.
Contracted capacity — ordered, paid for, in the supply chain: effectively all of 2026's server spend and most of 2027's leading edge. Sold out through 2027 at HBM and advanced packaging; allocation, not demand, currently governs delivery timing.
Built capacity — racked and powered: materially less than contracted, and the gap is the power story. Microsoft's cited ~$80 billion of unfulfilled Azure orders is the clearest published measure of the gap between what customers have committed to buy and what can physically run.
Available (grid-ready) capacity — the binding constraint: interconnection queues of 3–7 years in several US markets, transformer lead times of 2–4 years, and gas-turbine order books sold into 2028+. The DOE's 6.7–12%-of-electricity scenarios for 2030 are, in effect, a forecast of how much of the contracted boom can be energized on schedule.
Economically viable capacity — the open question: capacity that earns its cost of capital at plausible 2028–2030 token prices. Nobody's filing discloses this number, and it is where overbuild would show up first: not in construction statistics but in utilization and pricing, one to two years after the buildings open.
The practical reading: through 2026, the boom is supply-constrained and demand-exceeds-capacity at the margin. The risk case is not present in current utilization — it lives in the 2027–2029 cohorts, where capacity decisions are being made today against demand that is contracted but not yet observed.
5. Who supplies it: the Nvidia funnel and the concentration question
Money spent on AI compute passes through a narrow supply chain. Its narrowest point is one vendor.
Nvidia's position. Nvidia reported $96.2 billion of revenue in the quarter ended 26 July 2026, of which $89.0 billion was data center — annualizing to roughly $356 billion. Set against $733 billion of big-four capex, the equipment component of which flows disproportionately to accelerators and networking, that means on the order of half of the equipment money reaches Nvidia directly, with more reaching it via server integrators (Supermicro, Dell) and more still via second-order purchases (HBM memory from SK Hynix and Micron, advanced packaging at TSMC).
Customer concentration cuts both ways. Roughly 61% of Nvidia's revenue comes from a small set of large customers, per daloopa's tally of disclosures; Nvidia's own filings name direct customers that include the hyperscalers. The same four companies driving demand are therefore the sellers' concentration risk — and Nvidia's market value, which crossed $5 trillion during 2026, rests on their continuing to spend. Conversely, the hyperscalers' AI product roadmaps depend on one supplier's roadmap. Both sides have spent 2025–2026 trying to diversify — custom silicon (Google TPU, Amazon Trainium, Microsoft Maia), AMD accelerators, in-house networking — but each year's spending has so far concentrated further.
The second-tier dependence. One step downstream, the funnel narrows again: SK Hynix's HBM lines are sold out through 2027; TSMC's CoWoS advanced-packaging capacity is allocated years forward; high-bandwidth memory and copper supply tightness has pushed component costs up — a driver Amazon explicitly cited for raising its 2026 budget. Concentration plus allocation equals fragility: a demand pause at two or three buyers would propagate through the entire chain in a way that diversified demand would not.
The circularity question. The ecosystem contains loops that complicate demand signals: Nvidia has invested in OpenAI and other customers; Microsoft invests in OpenAI, which rents Microsoft and Oracle capacity; Oracle borrows to build for OpenAI, whose revenue depends partly on products run on that capacity. Each loop is rational individually; collectively they make contracted demand harder to read, because some buyers' ability to pay is linked to the sellers financing the purchase. Circularity is not fraud, and most such deals are disclosed — but it is a real analytical problem when judging whether end-demand supports the build-out.
6. The physical system: what a $733 billion year actually builds
Tracing the chain from budget to electrons clarifies where the constraint lives.
1. Budget → components. Roughly 60% of AI capex buys silicon (GPU/accelerator servers, networking switches, optics) and about 40% buys shells: land, buildings, cooling, substations (Alphabet's disclosed split; other companies' mixes are similar in kind). Components are ordered 6–18 months ahead; servers for 2026 were largely contracted in 2025.
2. Components → data center. An AI-ready hall takes 18–36 months from groundbreaking to racks, limited less by construction than by power: a single 1-gigawatt campus draws the electricity of a mid-sized city and needs transformers that currently carry multi-year lead times, high-voltage interconnections that queue behind regional grid studies, and in some markets water for cooling that local authorities must approve.
3. Data center → model → product. Racked accelerators train and serve models; revenue arrives only when enterprises or consumers pay for tokens, software or cloud. The demand evidence is real — Google Cloud backlog $514bn, Azure growth 30%+, record API adoption — but backlog is contracts to spend, not revenue received.
4. The electricity arithmetic. US data centers used about 4.4% of US electricity in 2023 (DOE/LBNL). LBNL's 2025 update projects 6.7–12% by 2030, with the reference case at 11.8% (649 TWh). Globally, the IEA's base case reaches ~945 TWh by 2030, roughly double today's share of about 1.5% of world electricity. Those percentages describe the demand; the supply side — new gas turbines (sold out into 2028+), nuclear restarts and PPAs, grid batteries, transmission — is being procured in parallel, and in several markets the power procurement, not the capital budget, is the critical path. Microsoft's publicly discussed constraint of roughly $80 billion in unfulfilled Azure orders tied partly to power availability is the clearest single illustration.
7. The telecom baseline: what the comparison does and does not establish
The 1996–2001 telecom boom remains the closest historical parallel, and it deserves precise treatment.
What rhymes.
- A capacity race funded at bubble intensity. Telecom carriers spent ~$120bn in 2000 alone (≈1.2% of GDP); the AI build-out runs at roughly twice that intensity relative to the economy.
- Debt at the margin. Telecom raised ~$1 trillion including borrowings; AI's financing is shifting the same way (Section 4), though from a far stronger starting balance sheet.
- Demand uncertainty over long-lived assets. Fiber depreciated over 20+ years while usage assumptions were extrapolated; AI campuses depreciate over 15–25 years while token-demand assumptions are extrapolated. Long-lived assets amplify forecast error.
- Concentration. A handful of equipment vendors (Nortel, Cisco, Lucent then; Nvidia, Broadcom, TSMC now) captured the spend, and their valuations embedded continued growth.
- Price collapse risk in the commodity layer. When overbuilt fiber glutted, wholesale prices collapsed even as total traffic grew exactly as forecast. The analogous layer in AI is generic model inference — if generic capacity outruns differentiated demand, token prices could collapse even as usage grows.
What does not rhyme.
- Who is building. Telecom builders were largely unprofitable challengers levering up against incumbents. The AI build-out is led by four of the most profitable, cash-generative companies in history — 2025 combined revenue of the big four was roughly $1.6 trillion (Amazon $716.9bn, Alphabet $402.8bn, Meta ~$200bn, Microsoft ~$281.7bn), with the capex still, for now, majority-funded from operations.
- What the asset does. Dark fiber sat idle for years; AI compute is scarce today, with backlogs and utilization supporting near-term returns. The risk is about 2028–2032 demand, not 2026 demand.
- Downstream effects. The fiber glut became the substrate for streaming, mobile broadband and cloud. Even the failure case of an infrastructure boom can leave the economy better off — the costs fall unevenly on the investors who financed the peak.
The defensible conclusion: the AI boom's intensity and financing direction rhyme with telecom; its starting balance sheets and current demand do not. The historical analogy argues for watching leverage and end-demand, not for predicting a 2001-style collapse.
How the telecom boom actually ended: the case in detail
The parallel deserves its evidence, because the ending is the part everyone remembers loosely.
The build. Between 1996 and 2001, telecom operators — incumbents, competitive local exchange carriers, and a generation of newly licensed long-haul builders such as Global Crossing, Qwest and Level 3 — laid tens of millions of miles of fiber. Sector capex ran at roughly $90–120 billion a year at the peak, funded by high-yield debt and equity raised against the expectation that internet traffic would double every 100 days (a figure that held only briefly and was extrapolated for years).
The turn. Traffic kept growing — the demand forecast was eventually right in direction and wrong in cadence — but the capacity arrived faster than revenue, and wholesale bandwidth prices collapsed as lit fiber competed for the same routes. Debt service did not fall with prices. WorldCom's accounting fraud (capitalizing operating costs to show profit) and bankruptcy in July 2002 — then the largest in US history — marked the finale; Global Crossing had failed in January 2002. Roughly half a trillion dollars of market value and a large share of the sector's debt were destroyed. Equipment vendors fell harder than carriers: Nortel went from Canada's most valuable company to a fraction of itself; Lucent survived only in merger.
The afterlife. The fiber kept working. Buyers acquired the assets in bankruptcy at cents on the dollar; the glut the boom created became the cheap substrate on which video streaming, cloud and mobile broadband were built a decade later. Society captured the value; the original capital largely did not.
Three transferable tests emerge from the record, each observable in AI today: the demand-cadence test (traffic doubled every 100 days → did token demand compound as fast as capacity is contracted?), the price-of-the-commodity-layer test (wholesale bandwidth collapsed → what happens to generic inference pricing?), and the debt-service-against-cash-flow test (debt service did not fall with prices → do the uncommenced leases and JV obligations flex when revenue disappoints?). The first test currently passes; the second is unresolved and worth watching as capacity scales; the third is the one the new financing structures were designed, deliberately, to blur.
8. The demand side: what is actually contracted, and what is promised
Distinguishing contracted from promised demand is where the boom's assessment becomes honest.
Contracted or observable today:
- Google Cloud backlog of $514 billion (mid-2026) — signed customer commitments, much of it AI-related, to be recognized over years.
- Nvidia's $89 billion quarter with a sold-out HBM/CoWoS supply chain into 2027.
- Azure, AWS and Google Cloud growth rates in the 25–48% range through 2026.
- Enterprise adoption surveys showing majority adoption of AI tools in large firms, and token consumption growing at triple-digit rates on major platforms.
Promised, conditional or circular:
- OpenAI's $1.4 trillion of planned infrastructure commitments over eight years, against annualized revenue reported in the tens of billions — the gap financed by successive equity and debt raises whose terms depend on continued market confidence.
- Vendor-financed purchases and capacity pre-payments that embed demand assumptions in their own financing.
- Sovereign AI programs announced across dozens of countries, most without identified budgets.
The mismatch between promised and contracted demand is not necessarily fatal — venture-scale bets are how transformative infrastructure gets overbuilt and then used. But it defines the risk precisely: the boom is safe while contracted demand grows; it becomes fragile when the promised layer (OpenAI-scale commitments, vendor financing, sovereign announcements) becomes the marginal driver of capacity decisions.
9. The disconfirming evidence: what would falsify the bear case
An assessment that only stacks risks is itself a bias. The strongest evidence against the overbuild thesis deserves equal standing.
The demand is contracted, not imagined. Google Cloud's $514 billion backlog is signed customer money — sovereign AI programs, enterprises, AI labs — recognized over years. Nvidia's order book is sold out through 2027 not because of one customer but across a customer base whose quarterly filings independently confirm the purchases. Overbuild episodes historically feature unsold capacity; today's constraint is the opposite.
Prices are not collapsing — they are rising. In the telecom record, the tell was falling wholesale bandwidth prices while capacity grew. In AI, GPU rental prices, HBM contract prices and data-center power prices have all been rising through 2025–2026, and component cost inflation is a stated reason for Amazon's guidance raise. A market where the commodity output gets more expensive as capacity expands is not behaving like a glutted market.
The builders' core businesses fund the bet. The telecom carriers were sub-scale startups whose failure would erase them. The four hyperscalers generated roughly $1.6 trillion of revenue in 2025 from search, retail, cloud, advertising and enterprise software that continue growing — the AI bet rides on cash flows that exist independent of its outcome. Even a total AI write-off, implausible as it is, would leave the builders profitable; that asymmetry has no telecom analog.
The efficiency lever is real and compounding. Inference costs per token have fallen roughly 10-fold per year across model generations; algorithmic efficiency gains (distillation, sparsity, better architectures) keep squeezing more capability per FLOP. The fiber glut was static glass; AI capacity gets more productive with each model generation. Falling unit costs historically expand, not shrink, total addressable demand (Jevons dynamics) — which is the bull case's strongest technical footing.
Power scarcity caps the downside. The binding constraint (Section 6) also functions as a market stabilizer: if demand disappoints, interconnection delays and transformer lead times naturally throttle how fast marginal capacity arrives, blunting the classic overshoot. The telecom glut was possible because fiber could be laid faster than demand grew. AI campuses cannot be energized faster than grids allow. The overbuild ceiling is, structurally, lower.
The honest synthesis: the bear case's strongest legs — financing drift, commitment stacks, concentration — are real but are process risks that unfold over years; the bull case's strongest legs — contracted demand, rising prices, funded builders — are present-tense facts. That combination describes a boom that is early in its risk cycle, not late. It also describes exactly how past booms looked one year before their turn, which is why the Section 11 indicators, not the narrative, are the operating answer.
10. The geopolitical dimension: statecraft arrives at a capex story
A private construction program of this scale cannot stay private for long. Three forces of state now bear on it.
Export controls shape the supply. US semiconductor export controls (October 2022, tightened 2023–2025, with further rounds under discussion in 2026) restrict China's access to frontier accelerators, while Chinese firms develop domestic alternatives under the constraint. The effect on the boom is twofold: it locks the four US hyperscalers in as the demand base for the highest-end supply, and it adds a geopolitical premium to every allocation decision — chips flow where policy allows as well as where revenue beckons. Malaysia, Thailand and Mexico have become the assembly and data-center staging grounds of the build-out partly for tariff and control-routing reasons.
Sovereign AI programs compete for the same inputs. Dozens of governments — the UK, France, Germany, Japan, Saudi Arabia, the UAE, India among them — announced national AI-infrastructure programs between 2024 and 2026, most pairing public capital with the same hyperscalers and the same chip vendors. In several European and Gulf projects, sovereign wealth funds have taken direct equity stakes in data-center joint ventures alongside Blue Owl-style private credit. The competition for a supply chain that is already sold out means sovereign demand is additive pressure on prices and lead times — and it embeds the build-out in national security planning, with the US government treating AI compute as strategic infrastructure (presidential directives, federal land expedite programs, grid coordination initiatives through 2026).
The power question is becoming a national planning matter. When data centers reach 8–12% of a national grid's load, interconnection approval stops being a utility matter and becomes an industrial-policy one. The US response has included federal coordination on grid interconnection queues, expedited permitting on federal land, and explicit utility-rate debates about who pays for the transmission upgrades data centers require — ratepayers or the buyers. The outcome of those rate-design fights, now active in Virginia, Georgia and Texas, will shape where the boom can physically expand through 2030.
The security dimension has a financial shadow worth naming: a boom this concentrated — five balance sheets, one dominant chip vendor, a handful of grid regions — is a systemic surface. US policymakers now discuss AI data centers the way previous generations discussed ports and refineries: too big to fail individually, too interconnected to let fail collectively. No rescue framework exists; the boom's financing (Section 4) assumes none is needed. That assumption is itself part of the risk case.
Who bears the risk: the transfer chain
The boom's downside, if it comes, will not land where the boom is visible. Tracing the risk transfer is essential to assessing it.
Equity holders carry the first loss: a meaningful AI-linked correction would come out of the S&P 500's largest weights — the hyperscalers and Nvidia together represent roughly a quarter of the index — with direct effects on retirement accounts and index-fund savers.
Private credit and JV lenders carry the marginal construction risk: Blue Owl, Apollo, Ares and peers have financed campuses against long-term leases from investment-grade buyers. Structure protects them partially (lease cash flows senior to equity), but a demand shortfall would hit renewal and re-leasing economics at the margin.
Bondholders and banks carry supplier risk: Oracle's debt stack, the syndicated data-center loans straining bank exposure limits, and vendor-financing books. Bank single-borrower concentration caps are the pressure point Wall Street has already flagged.
Pension and insurance capital sits at the end of the chain through its allocations to private-credit funds — opaque by design, marked quarterly by appraisal rather than by market, and therefore slow to signal stress. The telecom-era analog was high-yield mutual funds; the AI-era version is larger and less transparent.
Taxpayers enter only if failure meets systemically-large exposure — the scenario in which the 'too interconnected' logic overrides the no-bailout assumption. Nothing in the current structure contemplates it; the same was said of the banks in 2006.
None of this describes inevitable losses; it describes where losses would sit if the demand case fails. Risk transfer was the telecom boom's least-learned lesson: the fiber ended up used, the capital ended up elsewhere, and the difference was measured in who had bought at the peak.
The revenue side: what the spending must earn
The boom's arithmetic closes only on the revenue side. What has to be true for $733 billion a year to earn its cost of capital?
The current AI revenue base. The measurable AI-linked revenue flowing to the builders — cloud consumption, API tokens, AI subscriptions, AI-adjacent advertising improvements — sits in the low hundreds of billions annually across the industry. Against $1.05 trillion spent since 2023 and roughly $2 trillion more planned through 2028, the revenue base must multiply several-fold within the assets' economic lives. For scale: if the entire big-four capex since 2023 were required to earn a 10% return on capital, it would need to generate on the order of $105 billion of annual profit — roughly the total profit of a Fortune-10 company — attributable to AI capacity alone.
Where the revenue actually comes from. Three distinct streams, with different reliability. Cloud consumption is contracted and growing (the backlogs); it is the most bankable and the most cyclical, since enterprise cloud budgets flex with the economy. New product revenue — Copilot-style seats, API platforms, agentic software — is real but young; its pricing is still deflating as competition and efficiency gains pass through. Advertising uplift — better targeting and generation inside existing ad systems — is the quiet giant: even a mid-single-digit improvement in ad efficiency across the hyperscalers' ad businesses is worth tens of billions annually, and it is already partially banked. The less-discussed fourth stream — AI embodied in logistics, warehouses and retail operations at Amazon — shows up as margin, not revenue, and is invisible in most AI-revenue tallies.
The depreciation wall in the income statement. Each builder's server fleet depreciates on a 5–6-year schedule; buildings over 15–25 years (Microsoft's new schedule is 25). As the 2023–2026 cohort ages, annual depreciation across the four companies will rise toward $150 billion or more. Revenue growing 30% annually while depreciation grows comparably produces an earnings squeeze even in a success scenario — and a write-down scenario if revenue decelerates. The useful-life extension Microsoft adopted in July 2026 (15→25 years for buildings) flatters reported earnings by slowing the charge; investors reading the boom's P&L need to normalize for such choices.
The efficiency lever cuts both ways. Inference cost per token has fallen roughly an order of magnitude per model generation. Falling costs expand demand (more use cases clear the economic bar) — the Jevons dynamics that anchor the bull case. But they also erode the revenue per unit of capacity: a data center financed on 2026 token prices may find its output selling at 2028 prices an order of magnitude lower. The build-out is therefore a race between volume growth and price deflation, and the winning condition — volume growing faster than price falls — is precisely what Section 12's indicators measure.
The feedback loops that make booms accelerate — and turn
Boom dynamics are loop dynamics. Three loops are currently running in the same direction, which is why guidance keeps rising; the fourth runs the other way and is not yet engaged.
Loop 1 — capability begets demand begets capability. More compute enables better models; better models expand use cases; expanded use cases justify more compute. This loop has run unbroken since 2023 and is the fundamental driver. Its natural governor is the pace of model improvement: two consecutive generations without a capability jump would slow enterprise procurement.
Loop 2 — the supply-chain reinforcement. Every guidance raise commits multi-year component orders (HBM, CoWoS, transformers, turbines), which sell out the supply chain, which raises component prices and lead times, which raises the dollar cost of the next guidance round even at constant unit demand. Amazon's mid-year guidance raise cited exactly this. The loop converts scarcity into headline capex — a $733 billion year partly reflects $-inflation of the same physical build.
Loop 3 — the financing reflex. Rising asset values and revenue growth relax credit terms, which funds more capacity, which supports the asset values. Private credit's entry into data centers at scale is this loop engaging. It is the loop that historically runs longest and stops hardest.
Loop 4 — the depreciation counterweight (not yet binding). Every dollar spent depreciates on a 5–25-year schedule; from 2027 onward, annual depreciation charges on the cumulative $1 trillion will approach $80–150 billion across the four companies. When depreciation expense starts visibly compressing reported earnings without matching revenue growth, boards get their first hard accounting signal that capacity has outrun demand. This is the loop to watch from 2027; in every historical analog, the turn came through the income statement before it came through the order book.
Where the boom physically lives: the regional map
The build-out has a geography, and the geography has frictions.
Northern Virginia remains the world's largest data-center market — tens of gigawatts of concentrated load on a single grid region (PJM), where interconnection delays and local moratoria have already throttled expansion and pushed buyers south and west. Texas leads the new build on power availability and permitting speed, with ERCOT connection volumes dwarfing other regions and gas-turbine orders priced accordingly. Georgia, the Carolinas and Ohio absorb spillover with utility-scale campus announcements from every major builder. The Pacific Northwest competes on hydro and cooling; Arizona and Nevada on land and solar-adjacent sites, with water politics as the counterweight.
Internationally, Ireland hit its grid ceiling — national-level grid connection freezes pushed new projects to continental Europe; Frankfurt, London (West), Paris and Amsterdam (the 'FLAP' markets) carry European load under land and power constraints; Malaysia's Johor corridor and Thailand have become the assembly-and-cloud belt serving Southeast Asia; Japan, Singapore and Australia anchor APAC enterprise demand. Gulf sovereign projects (Saudi Arabia's HUMAIN, UAE's Stargate-linked campuses) pair sovereign capital with US technology in a bid to import the capability entire.
The map matters for two findings: first, the boom's constraint hierarchy differs by region (power in Virginia, water in Arizona, land in Ireland), so national aggregates hide the binding constraint; second, the growth of new regions (Texas, Johor, the Gulf) is the physical expression of the boom's second phase — the easy grid connections are used up, and the marginal campus now carries higher cost and longer lead times than the average already built.
The macro footprint: what the boom does to prices, wages and grids
At 2.3% of GDP, the boom stops being a sector story and starts leaving fingerprints across the macroeconomy.
Goods prices. The demand wave has repriced its inputs: copper for grounding and busbars, aluminum for racking, transformers and switchgear, gas turbines (order books sold into 2028 and beyond), and HBM memory — where contract prices rose sharply through 2026 and Samsung, SK Hynix and Micron allocated capacity years forward. General electrical-equipment inflation is now partly an AI-data-center phenomenon, a cost passed through to ordinary construction.
Labor. Skilled electrical trades are the bottleneck profession of the build-out: data-center electricians and linemen command premiums, union training pipelines have expanded to multi-year backlogs, and the build-out's labor demand is large enough to appear in regional wage statistics.
Grid planning and rates. In PJM, the grid region covering Northern Virginia, capacity-market prices cleared at records in the 2025 and 2026 auctions, with data-center load growth cited as a driver — a cost that flows to all regional ratepayers, feeding the political debate over who should pay for AI's electrons. Utilities across the American South have introduced or proposed large-load tariff classes specifically for data centers.
Capital markets. Data-center private credit, data-center REITs and AI-linked issuance have become a distinct asset class. When a category grows this fast, its marginal pricing influences broader credit spreads — another channel through which a demand disappointment would propagate beyond technology.
These footprints justify the GDP-relative framing: the boom's costs are already socialized through prices and grids even while its returns remain privatized and uncertain. That asymmetry — diffuse costs, concentrated bets — is the classic signature of infrastructure at scale, and the reason the financing question is the central unresolved variable.
11. Scenarios: three paths the spending could take
The scenarios below describe mechanisms and conditions, not predictions. Each is internally consistent with evidence available in September 2026.
Scenario A — Absorption. Enterprise and consumer AI revenue continues compounding at 30%+ annually; backlogs convert on schedule; power arrives at the pace the DOE midrange assumes. Capex growth decelerates from ~90% to 20–30% annually by 2028 as the base effect dominates, the build-out matures the way cloud did after 2016, and the hyperscalers' free cash flow recovers as revenue catches up. Indicators to watch: backlog conversion rates, token revenue disclosures, data-center utilization, FCF trajectory through 2027.
Scenario B — Pause and digest. A demand disappointment — enterprise budgets flattening, a model-quality plateau, or a macro downturn — coincides with rising component costs and power delays. Orders slow before capacity does: 2027 capex flattens or falls 20–30%, lease commencement slows, second-tier suppliers (server OEMs, memory, power equipment) feel it first, and hyperscaler FCF recovers as depreciation catches up. Markets reprice AI-linked equities and credit; the fiber-glut analog appears in generic inference pricing. No systemic crisis — the builders remain profitable — but a lost year for suppliers and a visible write-down cycle in speculative projects. Indicators: order-book revisions at Nvidia and server OEMs, data-center lease commencement rates, hyperscaler guidance language, credit spreads on AI-linked debt.
Scenario C — Overbuild and work-down. Contracted demand keeps capacity expanding to 2028 on assumptions that then prove optimistic; generic token prices collapse toward commodity economics; specialized assets (training campuses) are repriced or repurposed; financing structures (JVs, private credit, vendor financing) shift losses to non-bank lenders and, via them, pension and insurance capital. The physical infrastructure finds downstream uses — agents, robotics, scientific computing, media generation — the way dark fiber eventually carried streaming, but on a multi-year horizon and at investor cost. Indicators: token price deflation, asset impairments, JV repricing events, secondary-market discounts on data-center paper.
The evidence in mid-2026 — backlogs, utilization, sold-out supply chains — sits closest to Scenario A's conditions; the financing drift and commitment stack are the leading indicators of Scenario B's and C's preconditions. Both can be true at once: a productive boom whose marginal projects are speculatively financed.
12. What to watch: the five measurable tests
- Hyperscaler FCF. Does combined quarterly free cash flow recover above $20 billion by mid-2027 (absorption) or stay pinned near zero (financing stress)? FactSet and company filings publish this quarterly.
- Backlog conversion. Does Google Cloud's $514bn backlog convert on schedule, and do AWS/Azure backlog disclosures grow? Slowing conversion with growing backlog is the classic overbuild signature.
- Nvidia's concentration. Do the top customers' share of Nvidia revenue keep rising? Concentration above ~65% would mean the supply chain is betting harder on the same five balance sheets.
- Power. Do LBNL/DOE electricity-share estimates track toward the 8–12% band on schedule? Interconnection delays appearing in ISO queues and transformer lead times would shift the binding constraint earlier.
- Credit spreads. Do spreads on data-center JVs, private credit and AI-linked corporate paper widen ahead of equity volatility? Credit prices leverage risk earlier and more honestly than equities.
13. Limitations
- No AI-only capex disclosure exists. All capex figures follow company headline definitions; lease treatment differences (Amazon cash capex, Meta lease-inclusive, Microsoft classification-sensitive) mean cross-company comparisons carry ±10–15% definitional noise.
- The $1.05 trillion cumulative figure is a reconstruction, not a company-reported total; fiscal-calendar alignment and lease timing introduce estimate uncertainty of roughly ±$50 billion.
- The telecom 1.2%-of-GDP comparison uses a sector capex estimate ($120bn in 2000 dollars) and that year's GDP; alternative estimates of the sector's spend (including non-carrier infrastructure) range higher, which would narrow the ratio.
- Revenue-concentration figures for Nvidia rely on disclosed customer groupings; actual end-customer shares are inferred, not reported.
- Forward guidance is guidance. 2026 figures are company plans as of Q2 2026 earnings; they have been revised upward every quarter for two years and may be revised again.
- OpenAI's $1.4 trillion is a plan disclosed across multiple deal announcements, not a signed single commitment; its components span different time horizons and conditions.
14. Conclusion
Measured against every available yardstick — its own history, the companies' revenues, the economy's size, the closest historical parallel — the AI infrastructure boom of 2023–2026 is the largest and fastest private construction program ever recorded. $1.05 trillion spent in three and a half years; $733 billion more planned in one year; roughly twice the telecom bubble's peak intensity relative to GDP; a funding model drifting, at the margin, from operating cash toward credit.
None of that arithmetic settles whether it ends in absorption, pause or overbuild — the demand evidence is genuinely strong today, and the builders are genuinely strong balance sheets, and both facts coexist with a commitment stack ($1.4 trillion at OpenAI, $662 billion of uncommenced leases, $237.7 billion of Meta contracts) whose payment schedules now extend a decade into an uncertain future.
What the measurement does establish is what to watch. Five tests — free cash flow, backlog conversion, supplier concentration, power interconnection, credit spreads — will distinguish the scenarios while there is still time to act on the distinction. That is the function of measurement in a boom: not to call the top, but to make the evidence legible while the outcome is still being decided.
Appendix A. Data tables
Table A1. Big-four capex, headline definitions, $ billions
| Company | 2023 | 2024 | 2025 | 2026 (plan) | Source basis | |---|---|---|---|---|---| | Amazon (cash capex) | 48.1 | 77.7 | 128.3 | ~220 | 10-K filings; Feb & mid-2026 guidance | | Alphabet (purchases of P&E) | 32.3 | 52.5 | 91.4 | 195–205 | 10-K filings; Apr & Aug 2026 guidance | | Meta (P&E + finance-lease principal) | 28.1 | 39.2 | 72.2 | 130–145 | Filings; Q2 2026 guidance | | Microsoft (cash P&E, fiscal years) | 28.1 (FY23) | 44.5 (FY24) | 64.6 (FY25) | ~175 (CY26, adj.) | Filings; Jul 2026 guidance | | Combined (calendar-aligned) | ~144 | ~225 | ~380 | 720–745 | This report's reconstruction |
Table A2. Derived measures (this report's calculations)
| Measure | Value | Basis | |---|---|---| | 2026 capex midpoint | $733bn | Sum of guidance midpoints | | 2026 capex as % of US GDP | ≈2.3% | $733bn ÷ $32.38tn (IMF WEO Apr 2026) | | Telecom 2000 capex as % of GDP | ≈1.2% | ~$120bn ÷ ~$10.25tn (2000 US GDP) | | Cumulative big-four capex, Jan 2023–Jun 2026 | ≈$1.05tn | Filing reconstruction (±$50bn) | | Meta 2026 capex ÷ 2025 revenue | ≈69% | $137.5bn ÷ ~$200bn | | Microsoft 2026 capex ÷ 2025 revenue | ≈62% | $175bn ÷ ~$281.7bn | | Alphabet 2026 capex ÷ 2025 revenue | ≈50% | $200bn ÷ $402.8bn | | Amazon 2026 capex ÷ 2025 revenue | ≈31% | $220bn ÷ $716.9bn | | Nvidia DC revenue, annualized | ≈$356bn | $89.0bn (Q2 FY27) × 4 | | Nvidia DC revenue ÷ big-four capex | ≈49% | $356bn ÷ $733bn |
Table A3. Financing and commitments
| Item | Value | Date | Source | |---|---|---|---| | Meta–Blue Owl Hyperion JV financing | $27bn | Oct 2025 | Global Data Center Hub | | Meta subsequent data-center financing | ~$29–30bn | Late 2025 | Bloomberg/Octus tallies | | AI-sector corporate debt issuance, 2025 | ~$141bn | 2025 | Octus via Bruce Richards tally | | Uncommenced data-center leases, 5 companies | $662bn | Feb 2026 | Moody's | | Meta non-cancelable contractual commitments | $237.7bn | 31 Mar 2026 | Meta filings | | Meta uncommenced leases | $182.9bn | 31 Mar 2026 | Meta filings | | OpenAI planned infrastructure commitments | ~$1.4tn / 8 yrs | Nov 2025 | FT | | Oracle–OpenAI cloud contract | up to $300bn | Sep 2025 | WSJ/Reuters | | Google Cloud backlog | $514bn | Mid-2026 | Alphabet Q2 2026 | | Hyperscaler cumulative capex 2026–2030 | >$5tn | Proj. | S&P Global MI; Goldman ~$5.3tn (big four) |
Table A4. Electricity
| Measure | Value | Source | |---|---|---| | Global data-center electricity share, 2025 | ~1.5% | Our World in Data (Jul 2026) | | US data-center share, 2023 | 4.4% | DOE/LBNL (Dec 2024) | | US data-center share, 2030 (scenarios) | 6.7–12% | DOE/LBNL 2025 update | | US reference case, 2030 | 11.8% (649 TWh) | LBNL | | Global demand, 2030 (IEA base case) | ~945 TWh | IEA Energy & AI |
Appendix B. Methodology notes
Capex reconstruction. Calendar-year alignment: Alphabet, Amazon and Meta report on calendar years and were summed directly under headline definitions. Microsoft reports on a June fiscal year; its quarters were mapped to calendar quarters using its quarterly disclosures, and its calendar-2026 estimate uses the company's July 2026 guidance (~$175bn) following the useful-life reclassification, with the prior ~$190bn estimate noted where relevant. "Headline definitions" means: Amazon = cash purchases of property and equipment; Meta = purchases of property and equipment plus principal payments on finance leases; Microsoft = cash P&E with finance-lease commencements noted; Alphabet = purchases of property and equipment. Figures in billions of nominal US dollars; no inflation adjustment applied within the 2023–2026 window (adjusting 2023 dollars upward would make the growth rates marginally smaller).
GDP-relative comparison. Numerator: 2026 guidance midpoint, $733bn. Denominator: IMF WEO April 2026 US nominal GDP, $32.38tn. Telecom numerator: ~$120bn US telecom capex in 2000 (Fabricated Knowledge's compilation of carrier disclosures and industry tallies; Princeton's Starr and FRB studies corroborate the order of magnitude). Denominator: US nominal GDP 2000, ~$10.25tn (BEA). Result: 2.26% vs 1.17%. Sensitivity: if the telecom numerator is taken at $150bn (upper industry estimates), the ratio is 1.46% — the AI boom remains ~1.5–2× the telecom peak under any defensible pairing.
Ratios to revenue. 2026 capex midpoints divided by fiscal-2025 revenues as reported in Q4 2025 releases (Amazon $716.9bn; Alphabet $402.8bn; Meta ~$200bn; Microsoft ~$281.7bn — Microsoft's figure is its fiscal year ended June 2025, the other three calendar 2025). This pairs a forward spend with trailing revenue by design; pairing against 2026 revenue estimates would lower every ratio by 10–20%.
Nvidia annualization. Q2 FY2027 data-center revenue ($89.0bn, quarter ended 26 July 2026) × 4. Nvidia's fiscal calendar runs ahead of the calendar year; annualization is indicative, not a forecast, and quarterly revenue is rising, so the trailing-four-quarter figure is somewhat lower.
Commitment figures. Taken directly from filings or named-source reporting as cited; the $1.65 trillion aggregate is reported but not reproduced here as a sum, because its components mix categories (Section 4). No probability is assigned to scenarios; Section 9 conditions are qualitative descriptions tied to observable indicators.
Appendix C. For editors and researchers: quotable findings
- "The four largest hyperscalers plan $720–745 billion of capital expenditure in 2026 — approximately 2.3% of US GDP, roughly twice the telecom bubble's peak-year intensity relative to the economy."
- "Cumulative big-four capex crossed $1 trillion in mid-2026 — approximately $1.05 trillion since January 2023 — a reconstruction from company filings."
- "About half of the equipment spend flows to one vendor: Nvidia's data-center revenue annualizes to roughly $356 billion against $733 billion of planned capex."
- "Meta's 2026 capex guidance equals roughly 69% of its 2025 revenue; combined hyperscaler free cash flow has fallen from about $61 billion per quarter to under $5 billion."
- "The boom that began as the most conservatively financed construction program in corporate history is becoming, at the margin, a leveraged one: $662 billion of uncommenced leases, $27 billion Meta–Blue Owl JV, ~$141 billion of AI debt issuance in 2025."
- "US data centers consumed 4.4% of national electricity in 2023; the Department of Energy's scenarios reach 6.7–12% by 2030."
The Meridian Report publishes original research and analysis. Corrections: [email protected]. Data tables and methodology sufficient for independent replication are included above.