
The European Union began the winter with 72 percent of its underground gas storage in use, about 74 billion cubic metres, according to Gas Infrastructure Europe's winter readiness release of 9 October 2026. On the same date a year earlier, the European Commission and the gas transmission operators' network reported 83 percent, about 85 billion cubic metres. The gap is 11 billion cubic metres, about 117 terawatt hours at the standard conversion, and it is equal to 13 percent of the volume the bloc held at the start of the winter.
The reaction to that number has focused on the wrong constraint. Europe does not lack the ability to receive gas. It has about 1,600 terawatt hours of regasification capacity available per winter season, roughly 145 billion cubic metres, according to GIE's April 2026 assessment, and its annual LNG imports were about 131 billion cubic metres in 2025 on the Commission's figures. It has terminals, interconnectors and a functioning market. What it has less of is time, in the specific sense that storage is the instrument a system uses to buy time when the marginal cargo is expensive, and 2026 has started with less of that instrument than 2025 did.
The second finding is less discussed and more durable. The European Union's phase-out of Russian gas is measured overwhelmingly through the pipeline, where Russia's share of imports fell to 10.2 percent in the second quarter of 2026 on Eurostat data. In the same quarter, Russia supplied 17.3 percent of the bloc's LNG. The policy has not eliminated a supplier. It has moved the supplier from one segment of the import book into another, and the segment it moved into is the one that sets the marginal price.
What 72 percent buys, and what it does not
Storage is not a fuel. It is an option on fuel, and its value is the difference between the price of gas in October and the price of gas in February, multiplied by the volume that can be held and the speed with which it can be released. A full store means the system can decline expensive cargoes during a cold snap. An emptier store means it must buy them.
That distinction explains why the percentage matters more than the volume. Eleven billion cubic metres is a small number against annual consumption, but it is a large number against the drawdown range that a winter actually uses. A store that begins at 85 billion can deliver a deep winter's worth of gas and still hold a working minimum at the end of March. A store that begins at 74 billion has less room to be wrong about the weather.
The mechanism is not linear. Storage operators do not release gas at a constant rate. They release it when prices justify it, which tends to mean the coldest weeks and the moments when a pipeline outage or a shipping delay removes alternative supply. The last ten percent of a store is technically available but economically different from the first ten percent, because releasing it requires either withdrawing at rates that stress the facility or waiting for prices that make the withdrawal worthwhile.
There is a further asymmetry that the percentage hides. Storage is distributed unevenly across member states, and the countries with the largest volumes are not always the ones with the greatest need. A continental aggregate of 72 percent can conceal a member state at 95 percent and another at 55 percent, and the interconnectors between them determine whether the aggregate is meaningful. The Commission's winter outlooks have made this point for several years, and the 2026 release from GIE repeats it in the language of flexibility rather than volume.
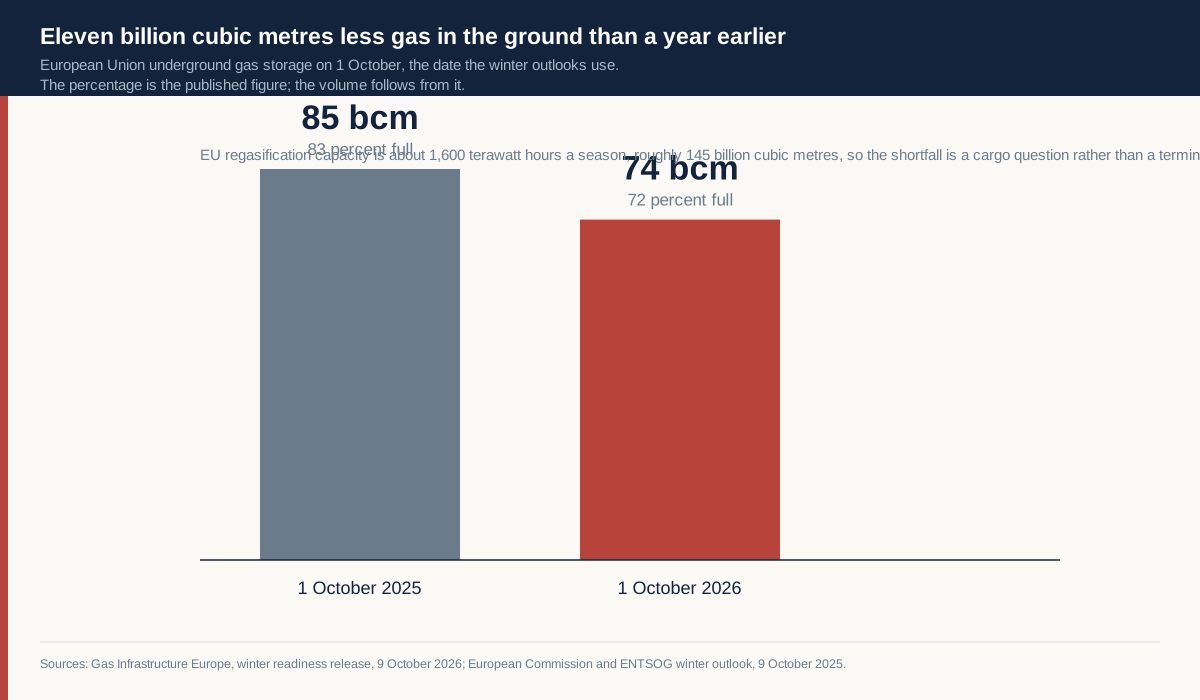
The arithmetic of eleven billion cubic metres
Convert the shortfall into terminal work and the picture becomes concrete. Eleven billion cubic metres is about 117 terawatt hours using the standard conversion of roughly 10.6 terawatt hours per billion cubic metres. Spread across a winter season, replacing that volume with LNG send-out requires the terminals to deliver around 7 percent more gas than they would have delivered from a fuller store, on top of the gas they were already going to deliver.
That is well within the system's physical capability, which is the reason the regasification figure is the right one to quote and the wrong one to worry about. Capacity of 1,600 terawatt hours per winter against a requirement in the low hundreds of terawatt hours means the terminals can physically do the job. What they cannot do is make the cargoes cheaper.
The price consequence is what the storage level actually determines. A well-stocked continent can decline a cargo that is offered at a price it does not like, wait for the next one, and use its own stored gas in the meantime. A less-stocked continent has to bid, and the bid is compared against buyers in Asia who are making the same calculation with their own storage and their own weather. The marginal cargo goes to the buyer who needs it most, and storage is the measure of how much a buyer needs it.
That is why the 2025 to 2026 comparison matters more than the absolute number. In October 2025 the continent entered the winter with a cushion that let it behave as a patient buyer. In October 2026 it enters with a cushion that is 13 percent smaller than the one it had a year earlier, which is a meaningful reduction in patience.
Regasification is not the constraint, and the terminal count proves it
Europe's LNG import system has expanded faster than its demand for LNG, which is an unusual combination and the source of much of the confusion in public discussion. GIE counted 33 operational large-scale terminals in the EU27 as of its November 2024 map release, with importing capacity of about 2,500 terawatt hours a year. That annual capacity is roughly 236 billion cubic metres on the standard conversion, against LNG imports of about 131 billion cubic metres in 2025.
Annual utilisation of roughly 52 to 58 percent follows from those two figures, and the width of the range is the conversion rather than the data. At 10.6 terawatt hours per billion cubic metres, 131 billion cubic metres is about 1,389 terawatt hours against 2,500 terawatt hours of capacity, or 55.5 percent. At 11.0 terawatt hours per billion cubic metres it is about 1,441 terawatt hours, or 57.6 percent; at the net calorific value of about 10.0 it is about 1,310 terawatt hours, or 52.4 percent. GIE does not publish a single aggregate utilisation rate and neither does the Commission, so this is an arithmetic construction from two published numbers rather than a published statistic. What it establishes is robust across the range: the fleet has room, and a winter that requires several hundred additional terawatt hours of send-out is a winter the terminals can physically serve.
The constraint that has replaced terminal capacity is commercial. A cargo of LNG is sold under a contract that specifies a destination, a delivery window and a price formula, and the flexibility to divert it is a contractual right that is paid for separately. Europe's ability to attract the marginal cargo depends on the price it offers relative to Asia, on the length of the voyage from the exporting terminal, and on whether the seller has a destination clause that permits the diversion. Those are commercial variables, and they respond to storage levels because storage is what determines how badly Europe needs the cargo.
Where the molecules now come from
Eurostat's second quarter 2026 trade data give the clearest picture available of the import book, and the two segments look like different worlds.
In pipeline gas, Norway supplied 51.2 percent, Algeria 18.2 percent, the United Kingdom 11.1 percent and Russia 10.2 percent of extra-EU imports in the quarter. In LNG, the United States supplied 63.2 percent, Russia 17.3 percent, Algeria 8.1 percent, and the remainder came from a list of smaller suppliers. The shares are within each import type, not of total gas imports, which is the detail that most commentary on the figures gets wrong.
Read together, the two sets describe a system in which the pipeline network has been reoriented toward Norway and North Africa while the LNG fleet has been reoriented toward the United States. Norway's dominance of the pipeline segment is the single largest structural fact in European gas supply and the one least discussed, because it is neither a crisis nor a policy. It is a neighbour with a mature offshore sector selling into the nearest market.
The Algerian position is more interesting than it looks. Algeria appears in both segments, at 18.2 percent of pipeline imports and 8.1 percent of LNG, which makes it the only supplier with a substantial presence in both. That dual presence gives it a flexibility that neither Norway nor the United States has, because it can shift volumes between a pipe and a ship depending on which market pays more.
The American position in LNG is the one that determines the marginal price more often than any other. At 63.2 percent of the bloc's LNG imports, the United States is not a supplier among many in that segment. It is the segment, and the price at which its cargoes clear is effectively the price at which European LNG is priced.
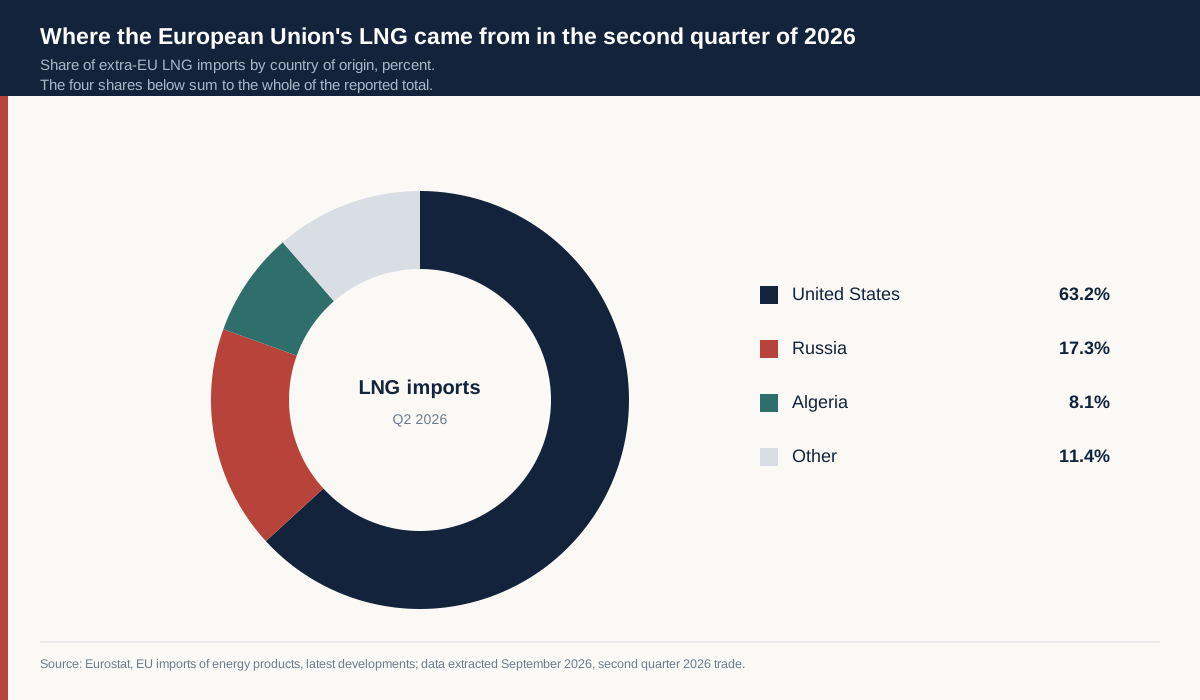
The phase-out moved rather than ended
The European Union's policy toward Russian gas has been judged by the pipeline share, and by that measure it has been a success. From a position of dominance before 2022, Russian pipeline gas fell to 10.2 percent of extra-EU pipeline imports in the second quarter of 2026. The Commission's 2025 annual figures put the Russian share of total gas imports at around 12 to 13 percent, down from 19 percent in 2024, and ACER's 2026 review puts Russian gas at about 12 percent of EU gas demand.
The LNG number tells a different story. Russia supplied 17.3 percent of the bloc's LNG in the same quarter, which is a larger share of its segment than its pipeline share, and it sits behind only the United States. Russian LNG reaches Europe from the Yamal and Arctic projects, through terminals that are not covered by the pipeline sanctions regime in the same way, and it is bought by companies that have found the contractual and logistical arrangements that the rules permit.
That is not necessarily a failure of policy. Sanctions are written to target specific transactions, vessels, entities and financial channels, and a supplier that reorganises its route can remain compliant while remaining present. But it does mean that the headline phase-out number describes one segment and not the system, and that a policy evaluated on the pipeline share will look more successful than a policy evaluated on the total.
The more consequential point is about price. Pipeline gas is priced on hub indices and long-term contracts with oil-linked elements. LNG is priced on a global market in which the marginal cargo clears against Asian demand. A supplier that shifts volume from the pipeline segment into the LNG segment moves its sales from a regional price to a global one, and a buyer that replaces pipeline gas with LNG moves its purchases into the same global market. The phase-out, in other words, has made Europe more exposed to the price formation it was trying to escape rather than less.
There is a countervailing consideration, and it deserves weight. Russian LNG volumes are small relative to the American volumes that dominate the segment, and the loss of them would be a manageable adjustment in a well-supplied market. The reason the share matters is not that the volume is large. It is that the share is rising in the segment where the marginal price is set, and that a rising share in that segment is a signal about how the market is clearing.
The British position: a week of storage and a rising LNG book
The United Kingdom's position is worth separating from the European Union's because it is quantitatively different and politically more exposed. The 2025 Statutory Security of Supply Report, published by the Department for Energy Security and Net Zero and Ofgem on 17 December 2025, records eight gas storage facilities in Great Britain, a maximum capacity of 3.2 billion cubic metres, and a maximum deliverability of 117 million cubic metres a day.
Three point two billion cubic metres is roughly a week of average winter demand, which is a derived comparison rather than a published statistic and should be treated as an order of magnitude. It is a small buffer for a market of the British size, and it means the country depends on continuous import flows through interconnectors and LNG terminals rather than on stored volume.
Those flows are increasingly LNG. The Digest of UK Energy Statistics records a 24 percent increase in UK LNG imports in 2025 compared with 2024, in a revision published on 29 September 2026 covering the country of origin of 2025 cargoes. The absolute volume was not available in the accessible tables, which is a limitation of this account rather than a finding, but the direction is clear and consistent with the European pattern.
A market with a week of storage and a growing LNG book is a market that prices on the marginal cargo every day of the winter rather than only in a cold snap. That is the structural consequence of the storage position, and it is the reason British prices have tended to track the global LNG market more closely than continental hub prices during periods of tightness.
How a store is actually used across a winter
A storage facility is a piece of physical equipment with a rate limit, and the rate limit is why the percentage is not the whole story. Every underground store has a maximum withdrawal rate, measured in millions of cubic metres a day, and a working gas volume, measured in billions of cubic metres. The ratio between them gives the number of days the store can deliver at full rate before it empties, and that ratio differs enormously between a salt cavern, a depleted field and an aquifer.
A store that can deliver its entire volume in fifteen days behaves differently from one that takes sixty, even if both are full on 1 October. The fast store is an insurance policy against a cold snap. The slow store is a seasonal balancing tool. A continental aggregate mixes the two, and the mix is what determines how the system behaves during the two weeks that actually matter.
That is why the official winter outlooks speak about flexibility rather than about volume. The relevant question is not how much gas is in the ground but how quickly it can be brought to a burner when a cold front arrives and the interconnectors are already at capacity. A system with a smaller volume but a higher deliverability can be more resilient than one with a larger volume and a slower rate, and the published aggregate does not distinguish between them.
The 2026 starting position is weaker on both dimensions than 2025 in the aggregate, because the volume is lower and the deliverability is unchanged. That combination is what makes the season sensitive to weather in a way the previous one was not.
The geography of the cushion
Storage is a national asset inside a continental market, and the distance between where gas is stored and where it is needed is bridged by interconnectors that have their own capacity limits.
Germany, Italy, the Netherlands, France and Austria hold the largest volumes, and each of them sits on a different part of the network. Germany's stores are close to the demand centres of central Europe and to the pipelines that bring Norwegian and Dutch gas. Italy's are close to the Trans-Mediterranean and Trans-Adriatic routes and give it access to North African and Caspian supply. The Netherlands has historically been a transit hub as much as a consumer. France sits at the junction of the Iberian, British and central European networks.
A member state with limited storage and limited interconnection is exposed in a way the aggregate does not capture. The Commission's winter outlooks have consistently identified the same group of countries as dependent on flows rather than on stocks, and the group has not changed much since 2022 despite the expansion of LNG capacity.
The practical consequence is that a continental storage number is a statement about the system's average condition, not about the position of any particular member state. A winter that is comfortable on average can still produce a regional shortage if a pipeline is unavailable at the wrong moment and the interconnector that would have covered the gap is flowing in the other direction because a neighbour is also short.
The contract layer that decides who gets the cargo
The physical system described above is only half of the mechanism. The other half is contractual, and it is where the difference between having terminal capacity and being able to use it becomes clear.
Most LNG is sold under long-term contracts with a destination clause, a provision that restricts where the buyer may deliver the cargo. A destination clause protects the seller's other markets and is priced into the contract. It also limits the buyer's ability to divert a cargo to the market that needs it most, which means that a terminal with spare capacity is not the same as a cargo with freedom to land there.
The flexibility to divert is a separate product. It is bought through contract terms, through portfolio players who hold multiple supply sources, and through the spot market, where a cargo without a destination restriction trades at a premium precisely because it can go anywhere. Europe's ability to attract the marginal cargo depends on how much of that flexibility it holds, and flexibility is the part of the system that cannot be measured in billion cubic metres.
This is the layer at which the storage deficit produces its real effect. A continent with a full store can afford to hold out for a flexible cargo at a price it likes. A continent with a smaller store has to buy whatever is available, and the price of availability is set by the seller who knows the buyer's position.
What the year-on-year comparison isolates
Comparing 1 October 2026 with 1 October 2025 isolates a single variable, which is the starting stock, and holds the rest of the system roughly constant. That is analytically useful, and it is also limited, because the rest of the system did not stay constant.
The terminal fleet is larger, the American liquefaction capacity behind the LNG book is larger, and the contract structure has evolved. Norwegian supply has been stable, and the pipeline from North Africa has been broadly stable. The Russian position has changed in the way described above, with the pipeline share falling and the LNG share rising.
What the comparison therefore measures is the difference in the cushion available at the start of the season, not the difference in the system's capability. A smaller cushion in a more capable system can be a smaller problem than the numbers imply, and a larger cushion in a less capable one can be a false comfort.
That is the honest reading of 72 percent against 83 percent. It is a real reduction in the system's ability to wait, and it is not a forecast of shortage, because the capability that would have to fail for a shortage to occur is considerably larger than it was a year ago.
Storage as a price rather than a quantity
The most useful way to think about the 72 percent is as a price signal that has already been paid. Filling a store in summer costs money, because the gas bought in July has to be financed until January and the operator takes the risk that the spread between the two periods will not cover the carry. A continent that ends the injection season at 72 percent has, in effect, decided that the marginal cubic metre of storage was not worth what it cost to put there.
That decision is rational at the level of an individual operator and revealing at the level of the system. When the summer forward curve and the winter forward curve are close together, the incentive to fill is weak, and storage ends the season lower than a security-of-supply calculation would prefer. When the spread is wide, filling is profitable and stores end the season full. The level on 1 October is therefore a market reading of expected winter scarcity, not an engineering failure.
That interpretation has a testable implication. If the 2026 level is a market judgement that the winter will be adequately supplied from LNG, then the spread between summer and winter prices should have narrowed during the injection season, and the market should be comfortable. If instead the level reflects a shortage of cheap summer cargoes, the spread should have widened and the market should be pricing scarcity already.
Neither can be settled from the storage number alone, and the published commentary from GIE describes the position in terms of weak market signals as well as physical levels. That is an important distinction, because a store that is empty because nobody wanted to fill it is a market outcome, while a store that is empty because the gas could not be bought is a supply outcome, and they call for different responses.
What would change the picture
Four developments would materially alter the arithmetic of this winter, and each is observable.
A mild winter across Northwest Europe would reduce the drawdown rate and make the 11 billion cubic metre gap irrelevant, because the gap is measured against a normal winter and a warm one uses much less. Weather is the largest single variable in any winter gas balance and the one least amenable to forecast beyond two weeks.
A cold winter in Asia would do the opposite, because it would raise the price of the marginal cargo and force Europe to bid for volumes it had assumed would be available. The two hemispheres compete for the same ships, and a simultaneous cold snap is the scenario that storage exists to cover.
A disruption to Norwegian supply would be more consequential than its share suggests, because Norway's 51.2 percent of pipeline imports is concentrated in a small number of large fields and pipelines. A prolonged outage on a single pipeline would remove a volume that LNG could replace only at a price, and the price would be set by the same marginal cargo logic.
A change in the treatment of Russian LNG would remove 17.3 percent of the LNG segment at a stroke. Whether that would tighten the market depends on whether the American volumes that dominate the segment can expand to fill the gap, which depends on liquefaction capacity that is fixed in the short run.
What the numbers do not settle
The storage figure is a snapshot of one date, and the release that published it, like every winter outlook, describes a starting position rather than an outcome. The 72 percent is precise to the whole number in the official release and no more precise than that, and the volume of about 74 billion cubic metres is derived from it rather than measured independently.
The import shares are quarterly and cover extra-EU trade, which means they exclude intra-EU flows and describe the origin of gas entering the bloc rather than its consumption. A country that imports gas from another member state is not visible in the data, and the shares therefore describe the border rather than the burner.
The utilisation estimate of 52 to 58 percent is an arithmetic construction from two published numbers, not a published statistic, and it moves with the calorific conversion used between terawatt hours and cubic metres.
What the record does establish is narrower and sufficient. Europe enters the winter with about an eighth less gas in the ground than a year ago, with terminals that can physically replace it, with a market that will set the price of that replacement against Asian demand, and with a supplier it has been trying to exclude now holding a larger share of the import segment that sets the marginal price than of the one it has successfully reduced.