
The war economy of 2026 is not one crisis with one cause. It is three conflicts that damage different parts of the same system, and the system adds them up. The war with Iran attacks the route. The Russia and Ukraine war attacks the refinery and the power grid. The Israel and Gaza war removes a pipeline, a market and a reconstruction programme that never started. A household buying diesel or bread in October 2026 is paying the sum of all three, and no government can decompose the price it sees into those parts.
That is the central fact of the year, and it explains why the policy response has been so incoherent. A supply shock from a closed strait calls for reserve releases and demand restraint. A capacity shock from destroyed refineries calls for the opposite, because refining capacity cannot be released from a stockpile. An inflation shock from both calls for monetary tightening, which slows the economy that is already absorbing the cost. And a fiscal shock from the response calls for consolidation, which is politically impossible while prices are still rising.
The year's published numbers describe the result. Global oil supply fell 5.8 million barrels a day in 2026, according to the International Energy Agency, to 100.7 million barrels a day. Brent settled at 109.86 dollars on 16 October after a week in which nine ships were attacked in the Strait of Hormuz. US diesel averaged 6.33 dollars a gallon, more than 70 percent above the same week last year. The World Trade Organization raised its goods trade forecast to 3.9 percent and cut its services forecast to 3.3 percent in the same release. The IMF projected 3.1 percent global growth and 4.7 percent inflation, and found that governments which suppress prices to protect households spend between 3 and 22 times more than governments that send targeted cash.
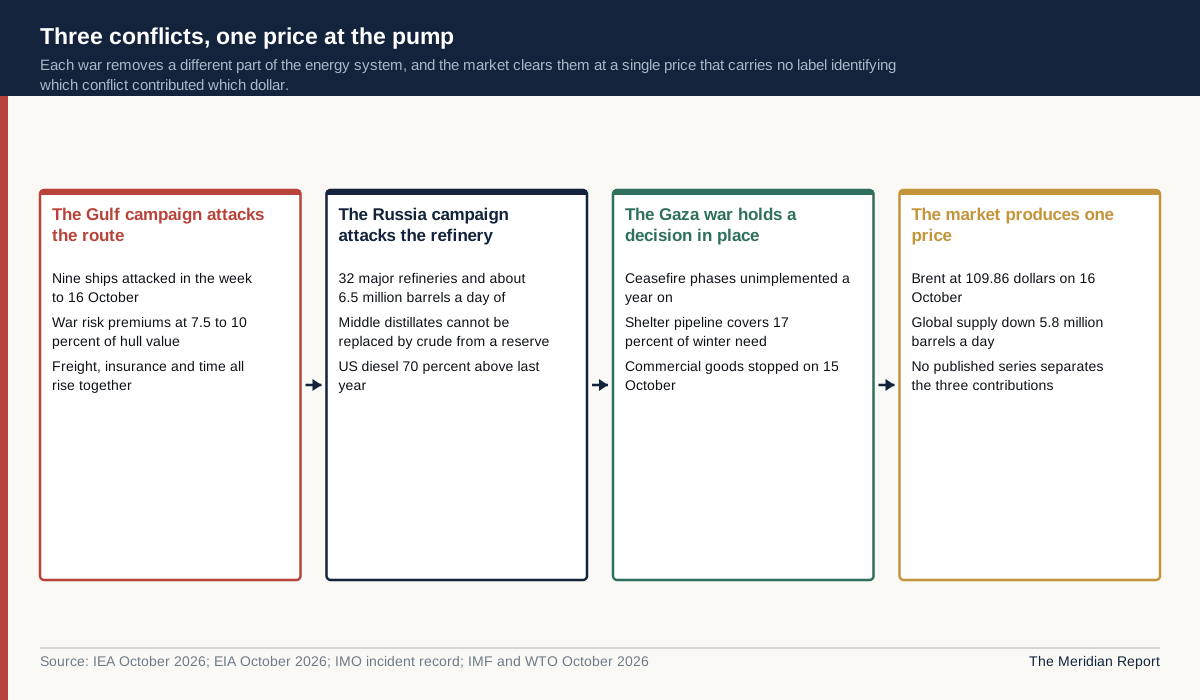
Each number is true, and each one is a partial view. This report assembles them into a single account, following the chain from the wellhead to the pump and the budget line, and marks the points where the record is strong and the points where it is not.
The barrel: supply lost and the buffers spent
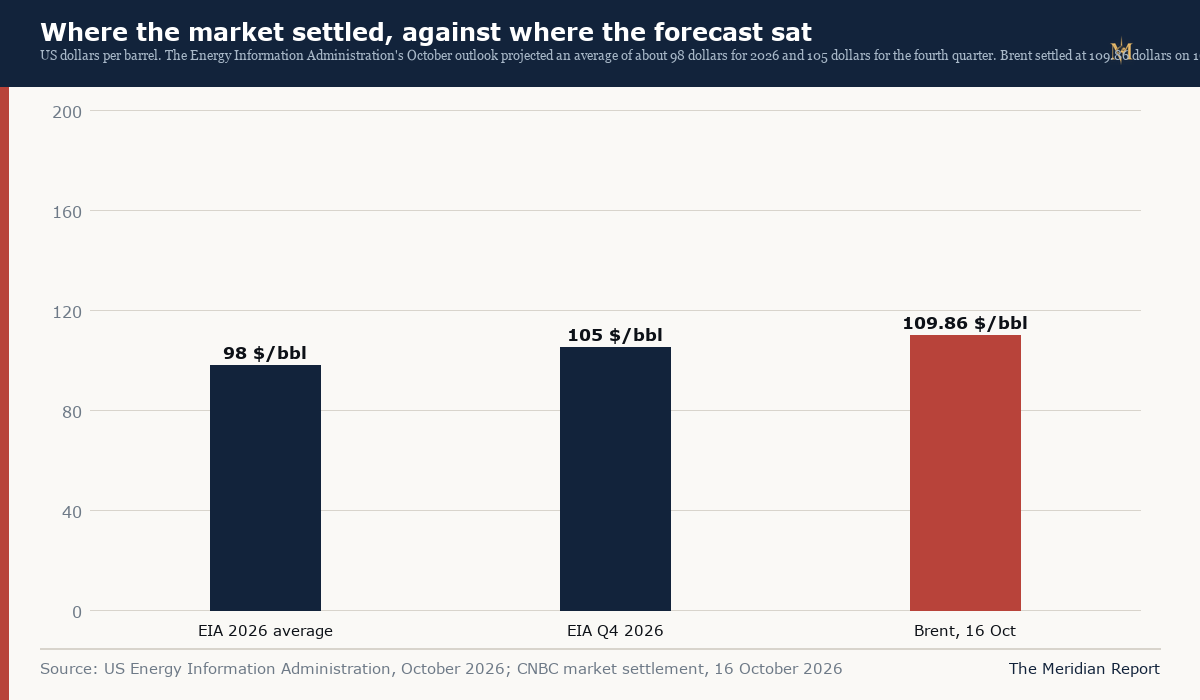
Start with the physical position. The IEA's October report puts 2026 global supply at 100.7 million barrels a day, a decline of 5.8 million barrels a day against the prior year. The Energy Information Administration's October outlook reports production shut-ins averaging 4.5 million barrels a day in the fourth quarter, and forecasts Brent at an average of about 98 dollars for 2026 and 105 dollars in the fourth quarter.
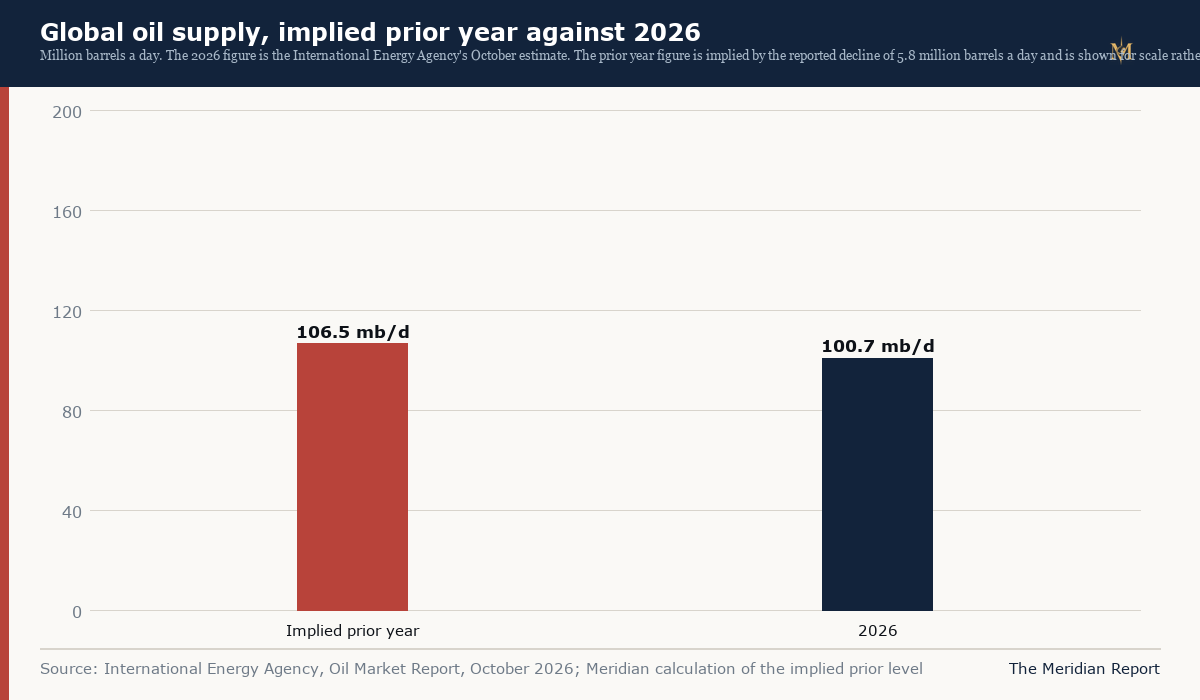
The two figures measure different things. The IEA's decline is the annual change in total supply, including the effect of fields that were already declining before the war. The EIA's shut-ins are the barrels that are not being produced because of the conflict. A reader who adds them together double counts, and a reader who treats either as the war's supply cost alone overstates it. The honest range for the barrels lost to the conflict in the fourth quarter is the EIA's 4.5 million a day, with the IEA's annual number as the broader measure of how much less oil the system has than it did a year ago.
Before the war, the Strait of Hormuz carried around 20 million barrels a day of crude, condensate and refined products, according to the EIA's chokepoint work, roughly a quarter of the world's seaborne oil. When the war began on 28 February, the IEA reported that flows through the strait fell to less than 10 percent of pre-conflict levels. By September, crude exports had touched pre-war levels again. In the week to 14 October, they were at 9.4 million barrels a day, about 70 percent of the pre-war average, according to Kpler data reported by CNBC.
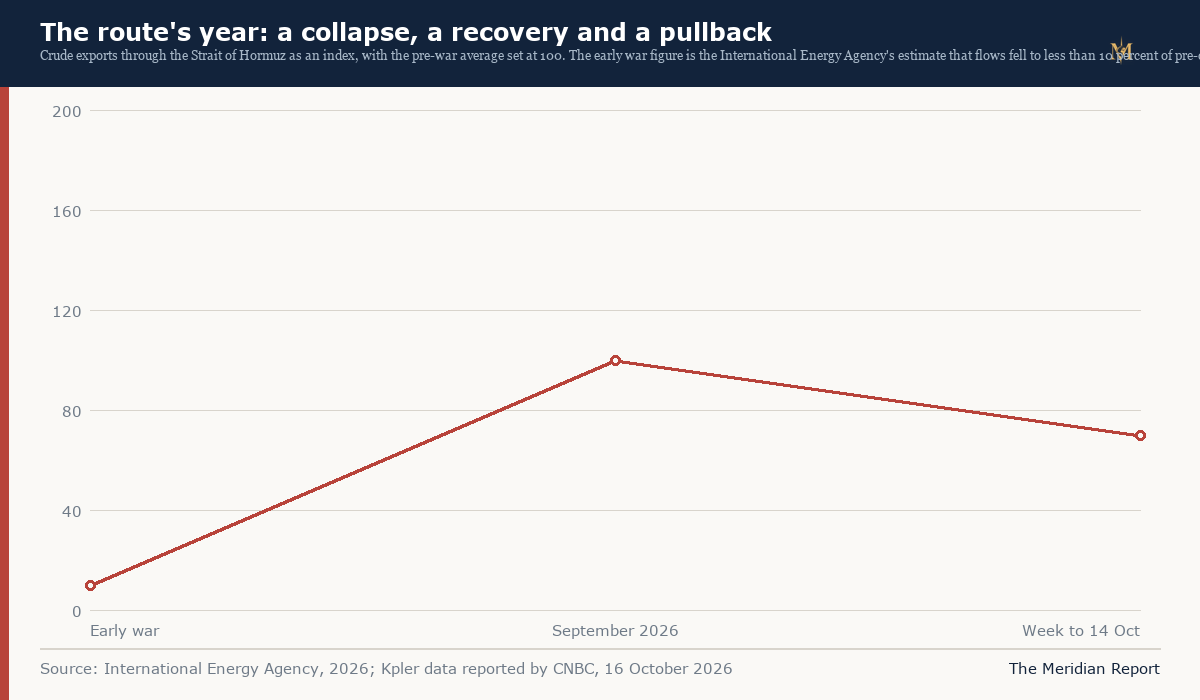
That path, 10 percent to 100 percent to 70 percent, is the year's most important sequence, and it explains why the market's reaction has been so different from the physical disruption. The first collapse produced a scramble. The recovery produced a market that believed the system had adapted. The October pullback produced a repricing that pushed Brent above 110 dollars in intraday trade for the first time since May.
Two buffers absorbed the first shock, and both are smaller now. The first was the strategic reserve. On 11 March, IEA member countries agreed the largest collective release in the agency's history, making 400 million barrels available. By 3 October, 325 million barrels had been delivered, with 75 million still to come. That is a one-time transfer from a stockpile to a market, and the stockpile does not refill itself while prices are high.
The second buffer was spare production capacity outside the conflict zone, and it was thin before the war. The EIA's 4.5 million barrels a day of shut-ins are not capacity that can be switched on, they are output that has been switched off. The IEA's annual supply decline of 5.8 million barrels a day is the measure of how far the system has moved from its capacity ceiling, and the ceiling is what determines how a second shock would be absorbed.
There is a third buffer that is not a buffer at all: demand destruction. When the price rises enough, consumption falls, and the fall is counted as a form of balance. It is a real adjustment and it is paid by households and firms rather than by producers, which is why it appears in the inflation data rather than in the supply data. The IMF's identification of energy-importing economies outside the technology value chain as facing the most difficult outlook is the same mechanism described from the demand side.
The route: Hormuz, the pipeline and the strait that replaced it
The barrels that continued to move after February did so through a smaller number of channels, and the concentration is the second structural fact of the year.
The first channel is the Saudi East-West pipeline, which carries crude from the kingdom's eastern fields to the Red Sea port of Yanbu. It is the single most important piece of substitution infrastructure in the system, and it moves crude rather than products, which means it can replace a barrel of export but not a barrel of diesel.
The second channel is the Bab al-Mandab and the Red Sea, and its security condition changed in September when Houthi forces completed their capture of Yemen's Red Sea coast and the islands in the strait, as documented in this publication's reporting on the chokepoint economy. The alternative to Hormuz now runs through a waterway controlled by the same network that is attacking Saudi Arabia.
The third channel is the Cape of Good Hope, which adds roughly 3,400 nautical miles and about ten days to an Asia to Europe voyage at service speed. It is always available and always expensive, and it consumes fleet capacity because each voyage takes longer, which reduces the number of voyages a ship can make in a year.
The week of 10 to 17 October tested all three at once. In the Strait of Hormuz, at least nine commercial ships were attacked between 11 and 16 October, and a Singapore-registered container ship, the GFS Pride, was sunk. US Central Command attributed the sinking to Iran; the IMO's incident list records it on 13 October while CNBC's account of CENTCOM's statement places it on 14 October, and the one-day discrepancy has not been reconciled. The IMO's regional tally for the wider conflict stood at 113 confirmed incidents and 24 seafarer deaths as of 14 October, with three seafarers injured and two missing in the week.
In Saudi Arabia, the attacks were aimed at the substitution infrastructure itself. A Houthi attack on Riyadh's international airport on 10 October killed 12 people and injured more than 300. On 13 October, an Aramco administrative building in Dhahran was hit. On 16 October, a Saudi military spokesman said several missiles had been intercepted over the Red Sea, including one heading toward the Yanbu oil export terminal, and that three drones had been destroyed over Riyadh and the south.
The Yanbu interception is the event that matters most for the year's economics even though nothing was hit. Yanbu is the Red Sea end of the pipeline that has substituted for the strait. A successful strike there would remove the alternative at the moment the primary route is under attack, and the system's redundancy would fall from two routes to one, which is the Cape. A market that prices the probability of that event is a market that prices a much larger interruption than the one that has occurred, and Brent above 110 dollars is a reasonable estimate of that probability.
The fourth fact about the route is that it is not only a physical system. It is an insurance market, a flag registry, a classification society and a set of charter contracts, and each of those institutions has its own way of deciding that a route is safe. The physical flow through Hormuz was at 70 percent in the week to 14 October. The institutional assessment of the route is a separate number, and it is the one that determines whether the flow recovers or falls further.
The freight and insurance ledger
Oil that moves on a longer, riskier route costs more to move, and the three components of that cost are freight, insurance and time.
Freight rates for Russian Urals shipments to India hit fresh records in early October, with coverage of the Reuters report citing a figure around 30 dollars a barrel. That is a charge on a barrel that sells at a discount, and it is paid out of the discount, which means the producer absorbs it. It is also the clearest evidence that the sanctions system has not stopped the trade: it has made it expensive, which is a different outcome with a different distribution of costs.
War risk insurance is the second component. Earlier in 2026, additional war risk premiums on Gulf transits rose from about 0.125 percent of hull value to a reported 7.5 to 10 percent. On a large crude carrier with a hull value of 120 million dollars and a cargo of 2 million barrels, a premium at 7.5 percent is 9 million dollars for the voyage, or 4.50 dollars a barrel spread across the cargo. At 10 percent it is 6 dollars a barrel. The assumptions matter and should be stated: a newer, more valuable ship pays a larger absolute premium, a smaller cargo spreads it over fewer barrels, and a ship that is not coalition-flagged or coalition-insured may face a different rate entirely.
Time is the third component, and it is the least visible. A voyage that takes ten days longer ties up a ship for ten more days, which reduces the effective size of the fleet. The same tonnage carries fewer barrels a year, and the shortfall is met by higher rates or by not moving the marginal cargo. That is why a route closure can raise the price of a barrel that never goes near the closed route: the fleet is a single pool, and a longer voyage anywhere tightens the pool everywhere.
There is a fourth cost that does not appear in the freight or insurance ledgers: the cost of uncertainty. A charterer deciding whether to fix a vessel for a Gulf voyage in November has to price the probability that the war escalates, that the insurance market withdraws cover, that a port closes or that a cargo is detained. Uncertainty that cannot be hedged is priced as a higher required return, and it shows up as a higher rate on every voyage, not only the risky ones.
The Suez Canal's numbers illustrate how these flows redistribute. The canal, which lost most of its transit traffic in the 2023 to 2025 Red Sea crisis, reported revenue of 4.67 billion dollars for its 2025/26 fiscal year, up 23 percent, and 1.26 billion dollars in the second quarter of 2026, up 13 percent, because tankers rerouted around the Gulf closure re-entered the canal from the south. A route that is losing traffic to a war can gain it back from a different war, and the country that owns it earns either way. That is the geography of a chokepoint economy: the water does not care why the ship is there.
The refinery: the second front that sets the diesel price
The diesel price is not a Hormuz story, and treating it as one is the year's most common analytical error.
A barrel of crude is not a barrel of diesel. The refinery converts one into the other, and the conversion step is fixed in the short run. Ukraine's campaign against Russian refineries removes conversion capacity from the system; Russia's strikes on Ukraine's energy infrastructure remove power, industrial capacity and export capability; and neither effect can be remedied by releasing crude from a strategic reserve. The IEA has documented the pressure on Russia's refining sector, which consists of 32 major refineries with about 6.5 million barrels a day of capacity, and the Dallas Federal Reserve reported that refinery outages were driving fuel prices further than the cost of crude.
The two campaigns ran in parallel all year and intensified in October. President Donald Trump announced an energy ceasefire between Ukraine and Russia on 11 October, and it unraveled within days: the Kremlin continued striking Ukrainian infrastructure, Ukraine paused its refinery attacks for three days and resumed them, and President Volodymyr Zelenskyy said Kyiv would keep striking Russian refineries. On 14 October, Zelenskyy was reported to have said that Russian attacks had damaged 30 energy facilities. On 16 October, strikes killed at least three people, including one in a food processing facility in Volyn, left about 370,000 people without power, and a separate report said more than 1 million consumers faced cuts at some point across Kyiv and five other regions.
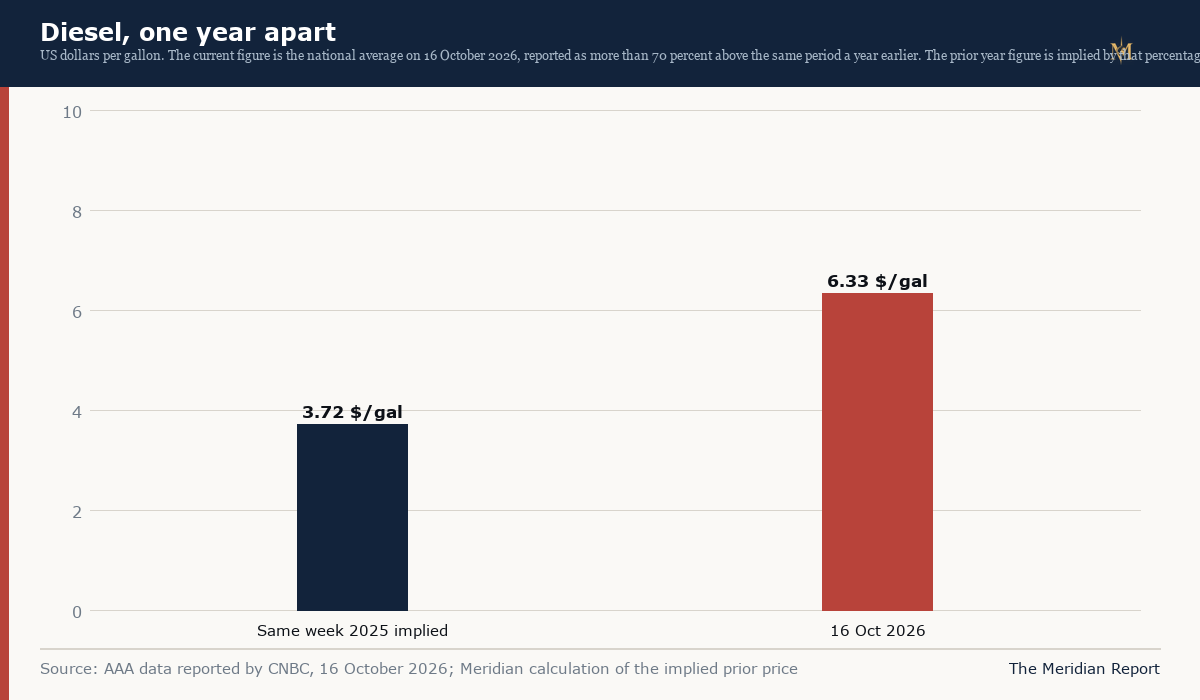
The diesel price is the joint product of both campaigns. US diesel averaged 6.33 dollars a gallon on 16 October, more than 70 percent above the same week last year, and the increase is larger than the increase in crude, which is what a refining constraint looks like in a price series. It is also concentrated in the middle distillates, the part of the barrel that freight, farming, construction and marine transport consume, and it is the part with the least substitutable demand.
There is a third contributor that has nothing to do with either war. The EIA reported a decline of more than 8 million barrels in US commercial crude inventories in the week to 9 October, driven by production shut-ins on the Gulf Coast from Hurricane Isaias. Weather and war arrived in the same inventory report, and the market had no way to separate them. The inventory number is the one that convinced traders the physical market was tighter than the price alone suggested, and it contributed to the week's move.
The structural conclusion is the one that matters for next year. The world has spent 2026 substituting around the loss of a route: rerouting cargoes, releasing reserves, buying from further away and paying for insurance. Those substitutions work on crude. They do not work on the product slate, because the product slate is set by the refineries that are still running. A diesel market 70 percent above last year is telling you that the substitution has reached the limit of what the crude system can do, and that the next increment of relief has to come from a refinery or from demand.
The sanction ledger: a cap nobody observes and a tariff nobody collects
The year's sanctions policy produced two instruments that are set far away from the market they are meant to govern, and both were suspended or inactive by mid-October.
The first is the oil price cap. The European Union's crude cap stands at 44.10 dollars a barrel, set on 15 January 2026 and effective from 1 February, and the 21st sanctions package in July paused the cap's automatic adjustment mechanism until 15 July 2027. Brent settled at 109.86 dollars on 16 October, so the cap sits about 65 dollars below the marker, and Russian barrels have been trading far above it for most of the year.
A price cap is not a prohibition. It conditions access to coalition shipping, insurance, financing and brokering on the cargo being sold at or below the cap, so it can only bind the cargoes that need those services. The Centre for Research on Energy and Clean Air's August classification found 52 percent of Russian seaborne oil exports on sanctioned shadow tankers, 42 percent on tonnage owned or insured by the coalition, and 6 percent on undesignated shadow tankers. The coalition side carried a minority of the trade, and that share is the direct measure of what the cap can control.
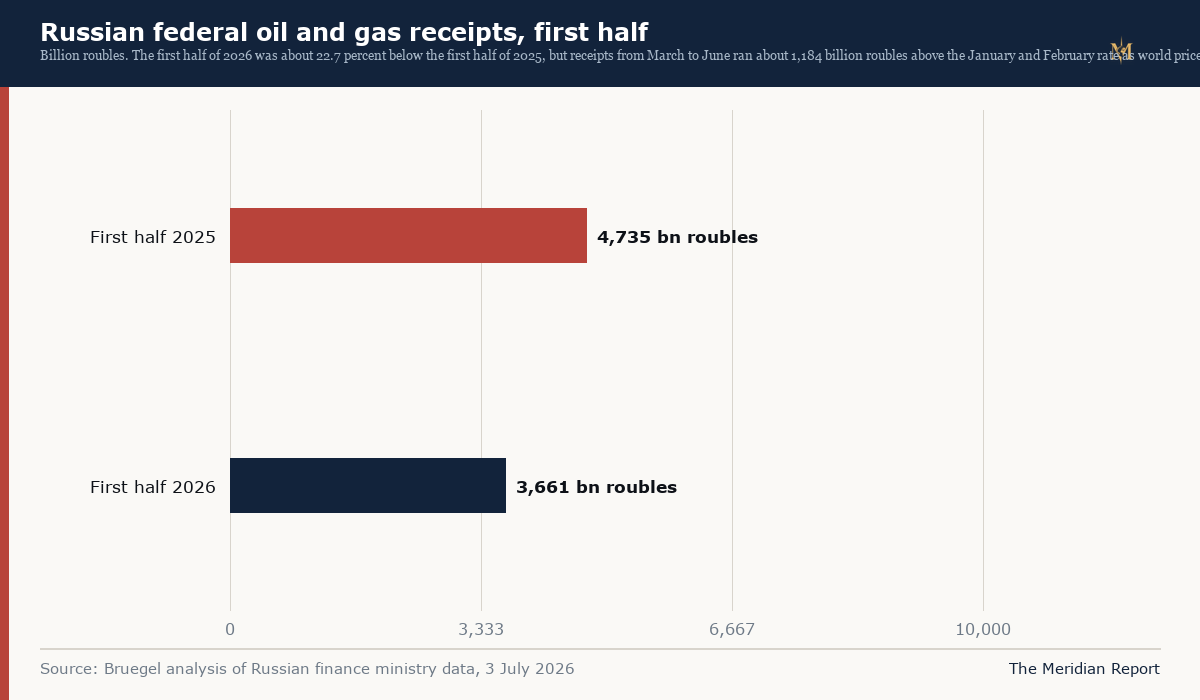
The revenue result is mixed in a way that sanctions debates rarely acknowledge. Russian federal oil and gas budget receipts for the first half of 2026 were 3,660.7 billion roubles, down from 4,734.7 billion in the first half of 2025, a decline of about 22.7 percent. But receipts from March to June were about 1,184 billion roubles above the January and February run rate, which the analyst attributed to the price surge that followed the Iran conflict. The Kyiv School of Economics Institute's September tracker reported Russian crude and product export volumes at their lowest since 2018 while higher prices lifted export revenues by just 0.3 percent. Volume fell, price rose, and revenue came out roughly flat, which is the signature of a sanctions regime that is restricting logistics rather than price.
The second instrument is the Lindsey O. Graham Sanctioning Russia and Iran Act, signed on 18 September 2026. It sets a 500 percent duty on goods from Russia, a 100 percent duty on goods from the five largest importers of Russian crude oil and natural gas if they knowingly make new purchases on or after 18 October, and a 100 percent duty on goods from the top five facilitators of Russian oil sanctions evasion. It also extends the Iran Sanctions Act to 2031.
On 16 October, the implementing executive order set those rates and then waived the duties and most of the Act's sanctions under its section 115 waiver, with a certification to Congress that the waiver is in the national interest. The waivers remain in effect until the President or the Secretary of State determines that further action is appropriate. The order preserves sanctions under pre-existing Russia-related executive orders, so the older designation architecture survives.
The economic logic of the waiver is straightforward. Tariffs on Russian goods collect little because the trade has collapsed, so the 500 percent rate is a political instrument rather than a revenue one. Tariffs on the largest importers of Russian energy would fall on the export sectors of countries whose trade is holding up the global goods forecast, and they would reduce the flow of Russian barrels into a market where Brent is above 110 dollars and supply is down 5.8 million barrels a day. The trigger is hardest to pull when oil is most expensive, which makes the law pro-cyclical by construction.
The European Union's contribution was a listing package. On 12 October the Council adopted restrictive measures against 1,569 individuals and entities, including 826 Russian companies and 743 individuals, the largest single set of listings the EU has agreed, bringing the total under the regime to close to 4,600. The targets are mid-level suppliers in the Russian military industrial complex with combined annual turnover of at least 20 billion euros and more than 250,000 employees, and they face asset freezes and travel bans. The package adds names to the service restriction regime without reconnecting the price cap to the market, which means the broader instrument is doing the less economic work.
Taken together, the three instruments describe a sanctions system that has moved from prices to names to tariffs, and has ended the year with a cap 65 dollars out of the money, a listing population of 4,600 entities, and a tariff schedule suspended by the order that wrote it. The Russian export machine is more expensive to run and no easier to stop, and the buyers have absorbed a cost that shows up in their own inflation rather than in a payment to any treasury.
The trade ledger: goods up, services down
The World Trade Organization's October update, released on 8 October, is the year's clearest statement that the war's economic effect is not a single number. The organisation raised its forecast for world merchandise trade volume growth in 2026 to 3.9 percent from the 1.9 percent baseline it published in March. In the same release, it cut its forecast for commercial services trade to 3.3 percent from 4.8 percent.
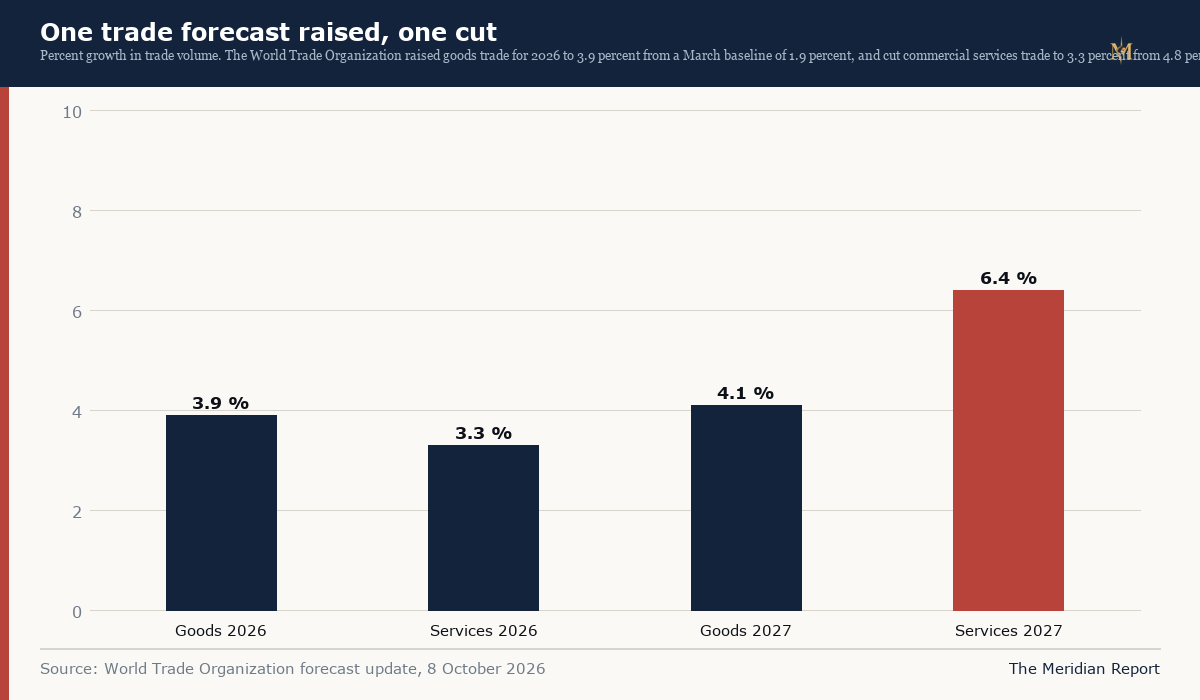
Goods trade grew because the physical volume of goods kept moving, and the WTO attributes the strength to AI-related demand and to supply-chain adaptation. Services trade fell because transport, insurance, travel and logistics are the services most directly exposed to a shipping war, and their volumes are suppressed by longer routes, higher premiums and lower confidence. The gap between the two forecasts, 2 percentage points up and 1.5 points down, is the year's economic split in a single table.
The regional data underneath the global average is where the cost sits. Middle East crude oil exports fell 24 percent year on year in the first half of 2026, and LNG exports fell 47 percent. Those are volume declines in the two products the region exists to export, and they happened in the same half year in which global goods trade beat its forecast. The global figure absorbs the loss because other regions traded more, and absorption is not compensation: the exporter that cannot load a cargo takes a revenue loss that no world average restores.
Services tell the same story from the other side. A war risk premium that rises from 0.125 percent of hull value to 7.5 or 10 percent is a price increase for a service that is still being provided, so the value of insurance sold can rise while the volume of cover falls. A rerouted cargo adds tonne-miles, so transport revenue can rise while the number of voyages falls. A services forecast that tracks volume records a decline in both cases, which is why the cut to 3.3 percent is the more honest number in the release: it is where the physical disruption is booked.
The forecast's dependency is the risk to watch. AI-related goods are high in value per kilogram, concentrated in a small number of production locations and tied to a corporate capital expenditure cycle that can pause. The IMF lists a reassessment of AI expectations as one of four downside risks to global growth, and the WTO's upgrade rests on the same sector. If the AI cycle slows while the war continues, both the goods upgrade and the services cut point the same way, and the two forecasts converge downward.
The 2027 projections make the dependency explicit. Goods volume is forecast at 4.1 percent, higher than 2026, and services at 6.4 percent, which assumes the war's effect on routes fades. A forecast that rises in the second year of a supply shock assumes the drivers are structural rather than temporary, and the three drivers of the 2026 goods upgrade, substitution, stockbuilding and AI investment, are structural in only one case.
There is also a measurement problem that flatters the goods number. Volume measures quantities and strips prices, so a world paying 110 dollars for Brent can report rising goods volume while its import bill rises faster. With the IMF projecting global inflation of 4.7 percent, the nominal value of trade is growing several points faster than its volume, which means importers are paying more for roughly the same physical quantity of goods. A volume forecast and a cost forecast are different instruments, and the WTO publishes the first.
The inflation ledger: energy in the middle of everything
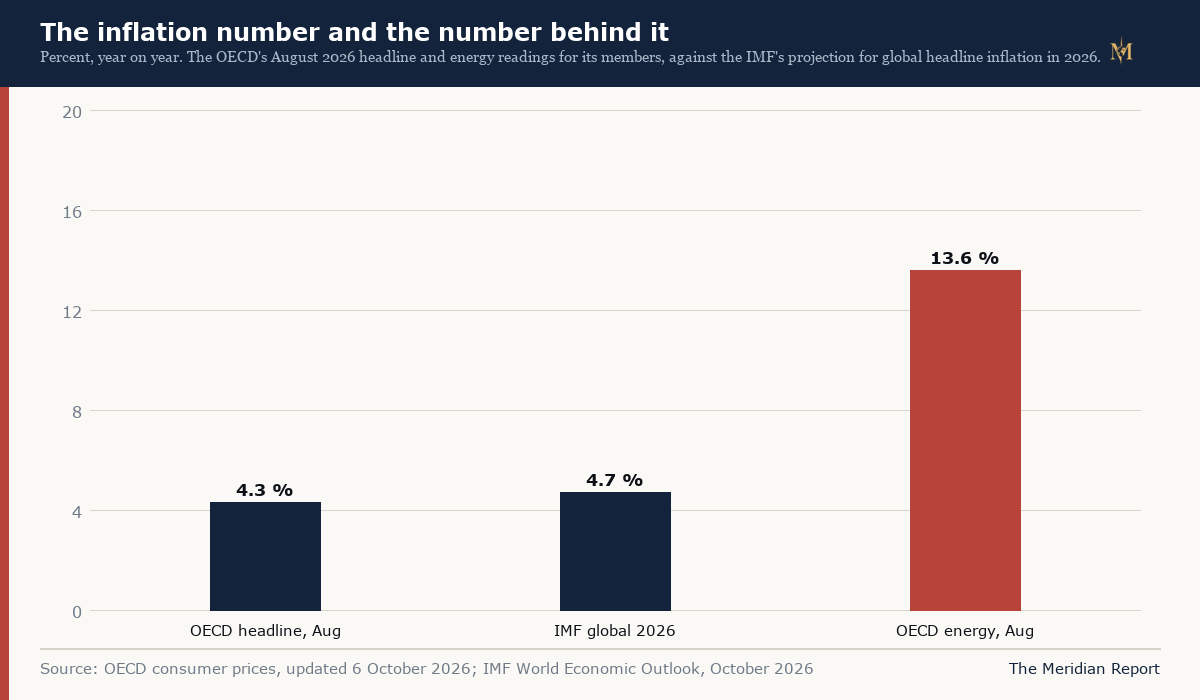
The IMF's October World Economic Outlook, published on 13 October, projects global growth of 3.1 percent in 2026 and 3.4 percent in 2027, and global headline inflation of 4.7 percent in 2026 easing to 4.1 percent in 2027, with core inflation at 3.9 percent and 3.7 percent. The projections use information available through 1 October.
The growth number is a small upgrade from the July update, which had 2026 at 3.0 percent, and the inflation number is described as cumulatively revised upward without the report quantifying the earlier forecast in its accessible summary. What is clear is the level: a global economy growing at close to its long-run trend with inflation nearly three points above the typical advanced economy target, and core inflation above 3.5 percent, is not a disinflation story. It is a plateau.
The distribution matters more than the average. Advanced economies are projected to grow 2.1 percent in 2026 and 1.8 percent in 2027, and emerging market and developing economies 3.7 percent and 4.4 percent. Within those groups the spread is wider: India at 7.0 percent in both years, China at 4.5 and 4.0, sub-Saharan Africa at 4.5 in both years, Latin America at 2.3 and 2.5, and the euro area at 1.1 percent in 2026. The Middle East and North Africa is projected to contract 1.3 percent in 2026, per Reuters reporting of the IMF's regional forecast, which is what happens when a region exports the commodity at the centre of the shock and cannot ship it.
The observed inflation data is more current than the forecast. The OECD reported headline inflation across its members at 4.3 percent in August, up from 4.1 percent in July, with energy inflation at 13.6 percent, up 2 percentage points from July, and G7 energy inflation at 14.0 percent, up 1.8 points. In the euro area, inflation rose to 3.8 percent in September from 3.2 percent in August, with energy among the drivers, and two ECB policymakers described the policy problem within three days: Olli Rehn said on 2 October that inflation could approach 4 percent by year end and that higher yields might curb some pass-through, while Philip Lane said on 5 October that higher energy costs, rising yields and shrinking budget support could weigh on growth and limit how much further monetary policy might need to tighten.
The arithmetic of the transmission is worth stating. Energy has a weight of roughly 7 to 10 percent in advanced economy consumption baskets. At 13.6 percent energy inflation and a 9 percent weight, energy contributes about 1.2 percentage points to headline inflation, which is roughly the distance between inflation that is falling toward target and inflation that is stuck. The contribution is larger for poorer households, which spend a bigger share of their budgets on energy, so the shock is regressive in consumption terms even when the policy response is not.
The report's most consequential finding is about the response rather than the shock. Chapter 2 examines cost-of-living crises and concludes that governments should preserve price signals and rely primarily on temporary, targeted income support, because measures that suppress prices can require 3 to 22 times more fiscal resources than targeted, temporary transfers.
The ratio is a comparison of fiscal cost per unit of household protection, and the three reasons it is so large compound. The subsidy is universal, so it pays households that do not need help. It scales with consumption, so the largest users receive the largest benefit. And it mutes the price signal, so consumption stays higher than it would be and the quantity that must be subsidised grows. The range from 3 to 22 describes how much those effects cost under different designs, which means the cost of the wrong instrument is partly a design choice and partly a function of how regressive the subsidised good is.
There is an honest counter-argument that the report does not resolve: targeted transfers require a household registry, a payment system and an eligibility rule, and the countries that subsidise fuel most heavily are often the ones that lack them. A finance ministry without a registry cannot deliver targeted cash this quarter, but it can hold a price down this afternoon. The choice it faces is between an inefficient instrument and no protection, and the fiscal cost of the first is easier to bear than the political cost of the second. The 3 to 22 ratio tells it what the interim costs. It does not tell it what to do by Friday.
The demand side: what a 110 dollar barrel does to consumption
The supply and policy ledgers explain the price. The demand ledger explains who stops buying, and it is the part of the adjustment that never appears in a supply forecast.
The first demand response is in transport fuel. Diesel at 6.33 dollars a gallon in the United States is a cost that trucking companies pass into freight rates within weeks, and freight rates pass into the price of everything that moves. The pass-through is not uniform: a retailer with thin margins absorbs some, a haulier with old equipment absorbs more, and a household at the end absorbs whatever remains. The demand response arrives last and is the least reversible, because a household that stops driving to work does not resume when the price falls by a dollar.
The second response is in industry. Energy-intensive manufacturing, fertiliser production, aluminium smelting and chemicals compete on the cost of power and feedstock, and when those costs rise relative to competitors outside the shock zone, output moves. The IMF's identification of energy importers outside the technology value chain as facing the most difficult outlook is a statement about exactly this: they cannot offset a higher energy bill with an AI export boom, and their industrial base is the part of the economy most exposed to the price.
The third response is in food, through the fertiliser channel and through transport. Diesel is the fuel of the farm and the truck, and fertiliser is made from natural gas, so an energy shock becomes a food price shock with a lag of one to two seasons. That lag is why the IMF's inflation path eases in 2027 rather than in 2026: the food component is still arriving when the energy component has peaked.
The fourth response is the one that governments try to prevent: the cut in discretionary consumption that turns a price shock into a demand shock. The higher the proportion of income that goes to energy and food, the larger the cut in everything else, and the faster a supply shock becomes a recession. This is the mechanism behind the IMF's emphasis on protecting the vulnerable with transfers rather than prices: a transfer maintains the purchasing power of the households most likely to cut spending, while a subsidy on a fuel consumed disproportionately by the better off does the opposite.
A demand-led adjustment has a strange political economy. The barrels that are released by demand destruction are the ones that make the market look balanced, so the price can fall while households are worse off, and a government can point to a lower price as evidence that the crisis is over while the consumption data shows it is not. Every energy crisis ends this way. The question is how much of the demand is destroyed permanently, because a permanent reduction in consumption is a permanent reduction in the standard of living of the households that made it.
The fiscal ledger: who pays, and who defers
The bills from the year are arriving in three places.
The first is the budget. The strategic reserve release transferred 400 million barrels from a public asset into the market, and the barrels are not coming back at the price they were bought at, because the price is higher now. Fuel subsidies, wherever they are being used, convert the energy price into a fiscal cost at a rate the IMF puts at 3 to 22 times the cost of a targeted transfer. And the defence budgets of the countries involved in the three conflicts have expanded, which is spending that competes with everything else the same governments fund.
The second is the balance sheet of the private sector. A shipping company that buys insurance at 7.5 to 10 percent of hull value is paying a premium that was 0.125 percent a year ago, and the premium is a cost that must be recovered from freight. A refiner that has lost a competing refinery earns a better crack spread and a refiner that has lost its own capacity loses revenue entirely. A trader that has to finance an extra ten days of transit is carrying more working capital for the same volume of business, and the interest on that capital is a cost that did not exist before.
The third is the household, through the pump, the food bill and the interest rate. The monetary tightening that central banks have not fully delivered is already priced into mortgages and credit, and the fiscal tightening that governments have deferred is waiting in the next budget.
The distribution of the burden between those three is the political question of the year, and the data does not answer it. What the data shows is that the burden is being deferred rather than allocated. Reserves were spent, subsidies were funded, borrowing was issued and buffers were drawn, and the IMF's instruction to rebuild fiscal space is a description of what has not happened. A year of deferral converts an energy shock into a debt stock, and a debt stock is paid by a future government with less room to answer the next shock.
The regional distribution is equally important. The Middle East and North Africa is contracting 1.3 percent in the IMF's projection because its export capacity is inside the war. Energy importers outside the technology value chain face the most difficult outlook because they pay the higher price with no offsetting export boom. The countries that are doing best are the ones with an AI-related export sector and domestic energy, which is a description of a small group. A war economy does not distribute its costs evenly, and the countries with the least fiscal room are the ones absorbing the largest relative shock.
The war ledger: Gaza's pipeline problem and the election pause
The third conflict enters the economic ledger through a door that does not look like an economic door. Gaza was not a major source of demand or supply for global markets, and its reconstruction is not large enough to move the oil price. What it does provide is the year's clearest example of how a war economy fails even when the fighting stops.
The ceasefire agreed on 8 October 2025 provided for a halt in fighting, the release of hostages, a partial Israeli withdrawal and more humanitarian aid. A year later, the first phase has largely held in the sense that full-scale war did not resume, and the later phases, including Hamas disarmament, full withdrawal and reconstruction, had not been implemented. The Security Council Report noted on 14 October that the plan's next phases were unimplemented, that Hamas had accepted a roadmap announced on 30 July, that Israel had reportedly rejected it, and that disarmament had not started.
The mortality data shows what a partial ceasefire is worth. The Gaza Health Ministry, as reported on 13 October, put the toll since the ceasefire at 1,493 killed and 5,299 wounded as of 12 October, with a cumulative total of 74,382 since October 2023. Taking those figures at face value and dividing them across the periods they cover gives an average of about 100 deaths a day before the ceasefire and about four a day after it, a reduction of roughly 96 percent. Both statements are true: the ceasefire is the most consequential thing that has happened to Gaza's mortality in three years, and it is still a body every six hours.
The humanitarian ledger is where the economy appears. The IOM, cited in the Security Council Report, reported that almost 2 million people needed shelter assistance, that the shelter pipeline covered barely 17 percent of identified winter needs, that nearly 1.8 million people were in displacement sites, and that about 8,600 shelter kits were being turned away at crossings. A kit serves a family, and at five to six people per family, the blocked kits represent roughly 43,000 to 52,000 people who have been identified, supplied and stopped by an administrative decision.
The reconstruction ledger has the same shape. The Board of Peace announced a 2.45 billion dollar recovery plan covering 66 programmes over six months on 24 September. The BBC reported that 18 billion dollars had been pledged and 280 million dollars handed over against an estimated requirement of about 71 billion dollars over a decade, with reconstruction not begun almost a year after the ceasefire. The handed-over figure is 1.6 percent of the pledge and 0.4 percent of the requirement, and the plan is 13.6 percent of the money already pledged. The constraint is a pipeline rather than a pledge, and the 8,600 kits at the crossings are the proof.
The commercial channel deteriorated further in the week before this report. Reuters reported on 15 October that Israel said commercial goods were no longer entering Gaza after merchants suspended coordination, amid an Israeli allegation of a tax dispute involving Hamas. Private trade is the part of a supply system that scales without a donor, and when it stops, the burden shifts to the humanitarian channel, which is already covering 17 percent of assessed winter shelter need.
Politics is holding the decisions in place. Israel votes on 27 October, in the first Knesset election since the 2023 attacks. On 14 October, Reuters reported Prime Minister Benjamin Netanyahu saying that a pre-emptive strike before the election was not convenient while reserving the right to respond to an attack, and the defence minister said Hezbollah would lose additional territory in southern Lebanon. On the same front, Lebanese forces seized hundreds of kilograms of explosives including TNT and C-4 on 5 October, and a Hezbollah member of parliament said on 15 October that the material belonged to Hezbollah and demanded its return.
An election does not stop a war and can start one. What it does reliably is raise the political price of visible decisions in the weeks before polling, and the decisions that Gaza and Lebanon require are exactly the visible kind. The deferral is rational for the government and expensive for the 1.8 million people in the displacement sites, and the bill is not denominated in dollars. It is denominated in a winter.
The company ledger: what uncertainty costs a trader
The most underreported cost of the year is the cost of deciding under uncertainty, and it is paid by firms rather than by governments.
Consider the decision chain for a European refiner buying a cargo of crude in October. It must choose between a Gulf barrel with a lower freight rate and a higher insurance premium, an Atlantic barrel with a shorter voyage and a higher price, and a Russian barrel that is discounted but requires a shadow fleet, a compliant buyer and a legal review of three sanctions regimes. Each option has a different cost, a different legal exposure and a different probability of disruption, and the refiner has to commit weeks before the cargo arrives.
Every layer of that decision has become more complex in 2026. The EU's listing population grew by 1,569 in one act on 12 October, which expands the screening obligation for every bank, insurer and logistics firm. The Graham Act sets duties that are currently waived and a trigger date that has passed, which creates a tail risk that cannot be hedged. The price cap is 65 dollars out of the money, which means the compliance question is documentary rather than economic. And the war risk premium is a moving number that depends on a week's incident count.
The result is that the transaction cost of moving a barrel has risen, and it has risen most for the firms least able to absorb it. A large trading house can staff a sanctions team, buy political risk cover and hold inventory across jurisdictions. A mid-sized refiner, a small shipowner or an exporter in an emerging market cannot, and the premium it pays for the same voyage is higher because its counterparties must price its inability to absorb a loss. Sanctions regimes that expand the designated population therefore consolidate trade in the largest firms, which is a real cost of the policy even when the policy achieves its intended effect.
Inventory is the other channel. A firm that expects disruption holds more stock, which ties up working capital and warehouse space, and the carrying cost is a real economic expense. The trade forecast's goods upgrade partly reflects that behaviour: front-loaded orders and higher inventories register as trade volume in the period before the disruption, and they register as a payback after it. The economy looks more resilient while it is building the buffer and less resilient when it spends it.
Contracting is the third channel. A charter party that was a standard form a year ago now needs clauses for war risk, route diversion, force majeure, insurance withdrawal and sanctions compliance, and each clause is negotiated with a lawyer and priced by both sides. This is the administrative tax that a war economy imposes on ordinary commerce, and it is invisible in every aggregate statistic. It shows up as a slightly higher price and a slightly longer delay on everything, everywhere, which is exactly how the year has felt to anyone trying to move goods.
Why the three conflicts cannot be priced separately
A reader who wants to know how much of the diesel price is the Hormuz campaign and how much is the Russian refinery campaign will not find the answer in any published figure, and the reason is structural rather than a gap in the data.
The three conflicts operate on the same market through different channels, and the market clears at one price. The Gulf campaign removes crude and products from the export side and raises the cost of carriage. The Russian campaign removes refining capacity and power from the supply side. The Gaza war removes a reconstruction demand that never materialised and holds a political decision in place. A barrel of diesel sold in Rotterdam in October is priced by the sum of all three, and the price does not carry a label identifying which conflict contributed which dollar.
The attempts to decompose them produce estimates, not measurements. The EIA's forecast of 105 dollars for fourth quarter Brent is a model that includes assumptions about all three. The IEA's supply decline of 5.8 million barrels a day is an annual aggregate that includes the Russian refinery damage, the Iranian export loss and the shut-ins. The WTO's 3.9 percent goods forecast and 3.3 percent services forecast are the same economy seen through two lenses. Each institution is measuring the same merged phenomenon with different instruments, and the differences between their numbers are mostly differences in what they count.
This has a policy consequence that is easy to miss. Because the shocks are merged, no single instrument addresses the whole problem. A reserve release works on crude and not on refining. A sanctions waiver works on prices and not on routes. A targeted transfer works on households and not on supply. A monetary tightening works on demand and not on any of the other three. A government that wants to reduce the price at the pump has to act on the route, the refinery, the sanction and the household at the same time, and each action has a different owner in a different ministry in a different country.
A second consequence is that the year's improvements have been marginal in a technical sense and large in a human one. Crude exports through Hormuz recovered from 10 percent to 100 percent and then fell to 70 percent. That path represents millions of barrels a day and the difference, for a household in an importing country, between an affordable month and an unaffordable one. It also represents no change at all in the underlying condition, which is that the route is contested, the refining capacity is damaged and the political decisions are deferred. The system has been managed at the margin for a year, and margin management is expensive, reversible and exhausting.
The third consequence is about forecasting. A forecast built on an average of a merged shock is a forecast built on a system that has not yet separated. When one conflict ends, the merged price falls by the part that conflict contributed, and the fall will be attributed by the market to whatever event is closest in time. A peace in Gaza would not lower Brent by a measurable amount, and a negotiation failure in the Gulf would, but the two would arrive through the same headline feed and be traded on the same day.
Thresholds: what would tell a reader that the loop is breaking
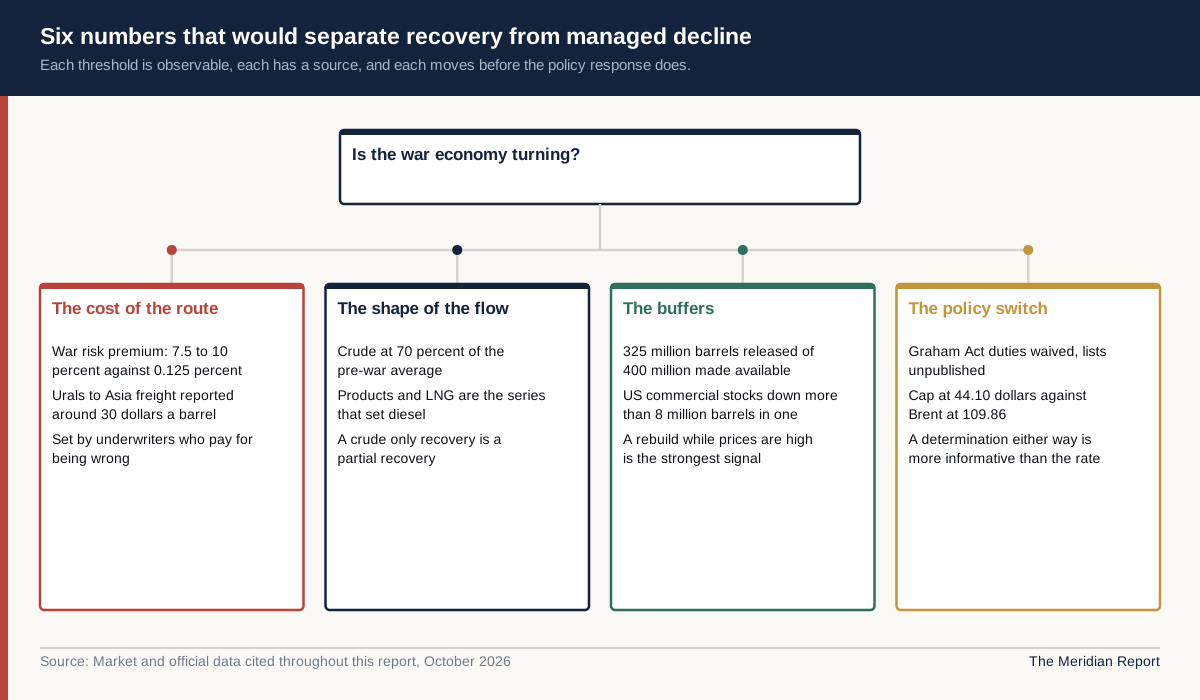
Six observable numbers would separate improvement from the management of a deteriorating situation, and each has a specific source and a specific meaning.
The first is the war risk premium on Gulf transits. It stands at a reported 7.5 to 10 percent of hull value, against 0.125 percent before the war. Underwriters price the probability of loss over the term of the cover, and a sustained reduction is the market's judgement that the route is becoming safer. A premium that stays flat while the attacks stop is a market that expects them to resume, and it is the earliest indicator that matters because it is set by people who pay for being wrong.
The second is the composition of the flow through Hormuz. The 9.4 million barrels a day of crude exports in the week to 14 October is about 70 percent of the pre-war average, and the crude series recovered faster than the products and LNG series. A recovery that shows up in crude alone is a partial recovery. A return of products and LNG to their own pre-war levels would be a different event, and it is the one that would move the diesel price rather than the crude price.
The third is the diesel crack, the difference between the price of diesel and the price of crude. It widened through 2026 because the refining capacity lost to the Russian campaign cannot be replaced by crude. A crack that narrows while the refinery attacks continue would indicate that capacity elsewhere has come back or that demand has fallen, and both are real improvements with different costs.
The fourth is the inventory position. The IEA's collective release delivered 325 million barrels by 3 October with 75 million still to come, and US commercial crude stocks fell more than 8 million barrels in the week to 9 October. Inventories are the buffer that turns a disruption into a price move, and their level is the best single predictor of how the next shock will be absorbed. A rebuild of stocks while prices are high is the strongest evidence that the system believes the crisis has passed, because it is expensive to do.
The fifth is the goods and services trade split. The WTO's 3.9 percent goods forecast and 3.3 percent services forecast will be revised in the next update. Services are the war's channel, so a services revision upward would mean the routes are normalising, and a goods revision downward would mean the AI cycle that offset the shock is slowing. The two numbers moving together in an upgrade would be the clearest signal of a genuine recovery.
The sixth is the sanctions switch. The Graham Act's duties are waived, the lists of largest importers and top facilitators have not been published, and the trigger date of 18 October has passed. A determination that revives the tariffs would be a demand shock in a market with 5.8 million barrels a day less supply; a decision to formalise the waiver would remove a tail risk from every trade contract with the affected countries. Either decision is more informative than the tariff's actual rate, because the rate was never the binding constraint.
A reader who wants one number to watch rather than six could do worse than the freight rate on a barrel from the Gulf to Asia. It prices the route, the insurance, the fleet and the expectation in a single figure, it is set by commercial parties rather than governments, and it moves before the policy response does. The Urals-to-India rate of around 30 dollars a barrel reported in early October is the high end of that measure. When it falls, the year will have turned.
The insurance market is the real referee
If one institution has more practical authority over the Strait of Hormuz than any government, it is the marine insurance market, and the year's most important decisions have been taken in underwriting rooms rather than in capitals.
The mechanism is simple to describe and difficult to overrule. A shipowner cannot trade a laden tanker without hull cover, protection and indemnity cover, and cargo cover. War risk is written separately as an additional premium, and the underwriters who write it designate areas where the cover applies on specific terms. A designation is not a political statement. It is a statement of expected loss, and it can be changed at any time.
The premiums are the visible part. Additional war risk on Gulf transits went from about 0.125 percent of hull value to a reported 7.5 to 10 percent during 2026. The invisible part is capacity: a market can quote a high premium and still decline to write the risk at all, and a refusal cannot be waived by a government. Insurance withdrawal would close the strait more completely than any attack, because a ship without cover cannot sail without breaching its financing covenants and its charter obligations.
The year came close to that condition without reaching it. The premiums rose by a factor of 60 to 80, the flows fell to a tenth of their pre-war level and recovered to 70 percent, and the market kept writing. Each step of the recovery was an underwriting judgement, and each judgement was made with less information than a government would demand. Underwriters price a distribution of losses across a fleet, and a fleet that keeps sailing despite attacks is a fleet whose loss experience is being measured in real time.
The institutional limits are visible in the humanitarian data. The IMO reported that around 20,000 seafarers, port workers and offshore crews had been affected in the region, and that a plan to evacuate around 6,000 seafarers had been paused. A crew war bonus compensates for risk accepted. It does not create a right to refuse, and the flag state, the shipowner, the charterer and the insurer each hold one piece of the authority that would be needed to stop a voyage. The IMO counts the deaths and does not control the movement of the people at risk, which is the sharpest illustration of how the system allocates authority.
For a reader trying to forecast the next phase, the insurance market offers the most reliable single signal in the system. It is composed of firms that lose money when they are wrong, it reprices continuously, and it cannot be persuaded by an announcement. A reduction in the additional premium while the attacks continue would mean underwriters had concluded the attacks were not aimed at insured tonnage. A withdrawal of cover while the attacks stop would mean the opposite. The premium is the market's verdict on the campaign, and it is published in every charter fixture.
The same barrel, priced five ways
One way to see the whole year is to price the same barrel five times and notice that the five prices disagree, because each one is set by a different participant with a different horizon.
The first price is the crude benchmark. Brent settled at 109.86 dollars on 16 October, up nearly 5 percent on the week and above the EIA's forecast of about 105 dollars for the fourth quarter. It is the most watched price and the least specific: it prices a cargo that may or may not exist, delivered at a date that may or may not be met, and it is the price that governments respond to.
The second is the freight rate. Urals shipments to India were reported at around 30 dollars a barrel in early October, a record, and that figure is the cost of moving a discounted barrel along a long route on a shadow fleet. It prices the distance, the port, the vessel and the risk of the voyage, and it is paid before the cargo is sold.
The third is the insurance premium, which appears as an additional war risk charge on the hull and a separate cost on the cargo. At 7.5 to 10 percent of hull value, it can exceed the freight rate on the same voyage, and it is the only one of the five prices that is set by a participant whose entire business is estimating the probability of loss.
The fourth is the product price. US diesel at 6.33 dollars a gallon, more than 70 percent above last year, is the price of the barrel after it has been refined, and it reflects a constraint that crude does not: the refinery capacity that is offline in Russia and the product slate that cannot be substituted. It is the price that households and hauliers actually pay, and it is the one that has moved furthest from its pre-war level.
The fifth is the fiscal price, which is what a government pays to keep the first four from reaching its citizens. It appears as a subsidy, a reserve release, a strategic stock draw or a tax cut, and it is the least visible of the five because it is paid from a budget rather than from a transaction. The IMF's finding that price suppression costs 3 to 22 times a targeted transfer is a statement about this price, and it is the only one of the five that does not appear in any market feed.
The five prices tell the year's story in a way that no single series can. The crude price recovered to a level the market could live with. The freight and insurance prices doubled and tripled. The product price stayed high because the refining constraint is physical. And the fiscal price was paid by governments that were already borrowing, which is why the IMF's instruction to rebuild fiscal space is the most consequential sentence in the year's official record.
A sixth price could be added for completeness: the price of not deciding. It is not quoted anywhere, and it compounds. Every month that the route, the refinery, the ceasefire and the sanctions remain unresolved, the buffers that absorbed the first shock are drawn down further, and the next shock finds a system with less inventory, less spare capacity, less fiscal room and less political tolerance for another transfer of wealth from households to the holders of the physical barrel. The year bought time with those buffers. It did not buy a solution, and time bought with inventory is not free.
What the record does not establish
The record does not establish a division of the year's price increase among the three conflicts. Every published aggregate mixes them, and the institutions that produce the aggregates do not publish a decomposition. Any figure that attributes a specific number of dollars to a specific war is an estimate from a model, not a measurement.
The record does not establish the true volume of the Iranian export loss. The IMO records incidents and the Kpler series records crude exports through the strait, but the two are not the same measurement and neither is a complete census of the barrels that did not move. The widely quoted figure of a fall to below 10 percent of pre-conflict levels in the early weeks of the war is an IEA estimate, and the recovery figures are Kpler estimates. Both are the best available, and both are estimates.
The record does not establish the full cost of the Russian refinery campaign. The IEA has documented pressure on a refining sector with 32 major refineries and about 6.5 million barrels a day of capacity, and the Dallas Federal Reserve has reported that refinery outages were driving fuel prices further than crude, but no published series measures the capacity that is offline on any given day or the cost of the products that were not made.
The record does not establish how much of the year's inflation is permanently embedded. The IMF's core projection of 3.9 percent for 2026 and 3.7 percent for 2027 assumes some persistence and no wage-price spiral, and the second-round effect is the difference between a temporary price level shift and a permanent inflation regime. The data available by mid-October cannot settle it.
The record does not establish the fiscal cost of the response. The IMF's 3 to 22 ratio is derived from episodes in the research literature rather than from a survey of current budgets, and no published aggregate measures what governments are spending to suppress prices this year. The number that would matter most for next year's policy space is the one that nobody has published.
The record does not establish the trajectory of the political decisions. The Israeli election on 27 October, the Gaza ceasefire's next phase, the Graham Act determination and the Iranian negotiation are all open, and each of them can change the others. A forecast that treats them as background is a forecast that will be revised.
What the year established
Three conclusions are supported by the record.
First, the energy system's redundancy has been consumed. The two buffers that absorbed the first shock, the strategic reserve and the spare capacity, are smaller than they were, and the two substitute routes, the Saudi pipeline and the Red Sea, are now inside the zone of attack. Redundancy is not a permanent property of a system. It is inventory, and 2026 spent it.
Second, the cost of the year is being carried in the two places that are hardest to measure: the product markets and the fiscal accounts. Crude is the visible market, and crude is the one that recovered. Diesel, jet fuel and heating oil are the hidden markets, and they are the ones that set the price of moving and growing things. On the fiscal side, the reserves were spent, the subsidies were funded, the borrowing was issued and nothing was rebuilt, and the bill for that deferral will be presented to a government that has not yet been elected in some cases and has not yet decided in others.
Third, the policy instruments that exist are all designed for a single shock and are being used against three. A reserve release, a price cap, a listing package, a tariff schedule, a targeted transfer and an interest rate each address one channel of a merged problem. The result is a year of marginal management: flows maintained at 70 percent, prices held below the level the physical market alone would produce, and every buffer drawn down a little further.
What the year has not produced is a decision. The route is contested, the refinery capacity is damaged, the ceasefire's second phase is unimplemented, the sanction is suspended and the fiscal space is spent. Each of those is a choice that has been deferred, and the deferral has been affordable only because the buffers were there to be spent. The next twelve months will be decided by whether they are rebuilt, and by whether the three conflicts that produced them end before the buffers run out.