
A production rate tells you how fast a factory is running. A stockpile tells you how many missiles exist somewhere. Set them beside each other and a reader will divide one by the other without being told to, because the arithmetic is obvious and wrong.
The chart below does the dividing for you and stops. Both panels are useful on their own terms, and the space between them is the point.
What the top panel measures
An interceptor is a missile whose job is to destroy another missile in flight. The systems in the top panel are the American ones, and each bar is an annual output rate, not a total on hand.
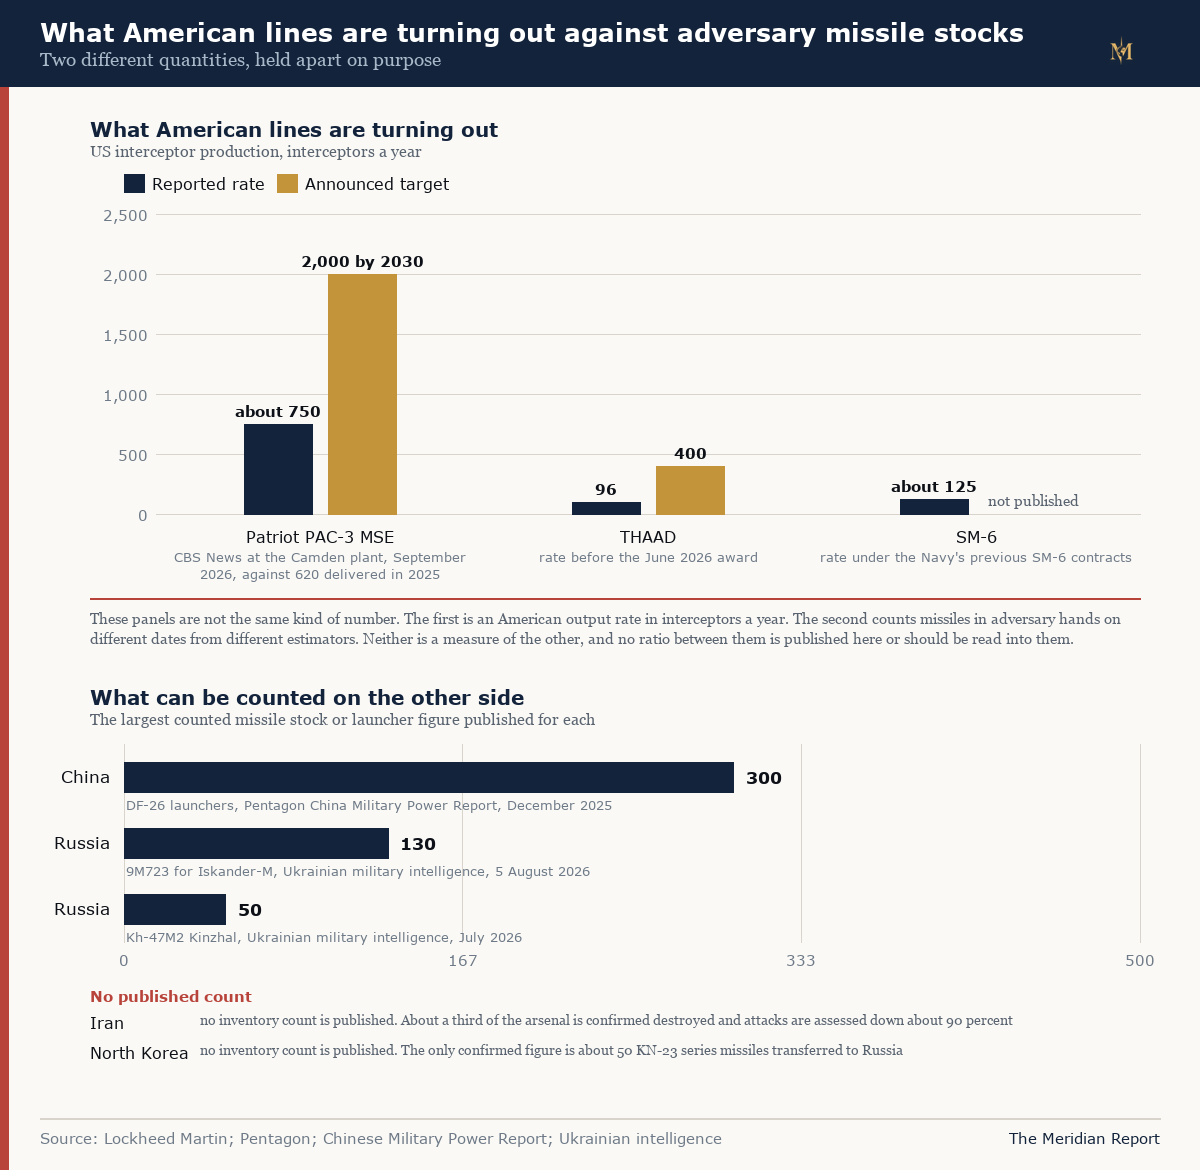
The Patriot PAC-3 MSE is the workhorse. It destroys ballistic and cruise missiles during their final approach, and it is the interceptor that every allied customer in Europe and East Asia has been ordering since 2025. Lockheed Martin delivered 620 in 2025, which works out at about 1.7 a day, and CBS News reported a rate of roughly 750 a year from the Camden plant in September 2026. A January 2026 agreement with the Pentagon targets 2,000 a year by 2030.
THAAD sits higher and is not interchangeable with the Patriot. It is the system meant for high altitude threats, it is bought in far smaller numbers, and its unit cost is roughly three times higher. Production ran at about 96 a year until the Pentagon awarded Lockheed Martin a seven year contract worth up to $35 billion on 24 June 2026, which the company has said will take output to about 400 a year.
The SM-6 is different again and is often miscounted in this field. It is not a dedicated missile defence weapon. It is a multipurpose interceptor used for fleet air defence and surface warfare first, with missile defence as one application among several. The Navy's previous contracts ran at about 125 a year. The agreement signed on 1 October 2026 is valued at up to $25 billion but states no annual rate, which is why that bar has a label and no target.
What the bottom panel measures
The bottom panel is not a like-for-like comparison. It is the largest figure that has actually been counted and published for each named actor, and the basis of each count is printed under its bar so you can see what kind of number it is.
Three of those counts exist. China's 300 is DF-26 launchers, from the Pentagon's December 2025 China Military Power Report, up from 250 in the previous edition. It is a launcher count, not a missile count and not a warhead count. Russia's two figures come from Ukrainian military intelligence: about 130 9M723 missiles for the Iskander-M as of 5 August 2026, and about 50 Kinzhal air launched ballistic missiles as of July 2026, with Kinzhal production paused since April.
Two actors you cannot count
Iran and North Korea have no bar, and that absence is not a gap in the research. It is the finding.
For Iran, the public record is a share rather than a total. Reuters reported in March 2026 that the United States could confirm only about a third of the arsenal destroyed, and that a Pentagon official put Iranian missile and drone attacks down about 90 percent from the start of the war. A percentage of an unstated base is not a stock figure, and converting it into one would require inventing the base.
For North Korea there is no inventory estimate in wide use at all. The single confirmed figure is about 50 KN-23 series missiles transferred to Russia, reported by Ukrainian security authorities for July 2026. Open source estimates of the wider North Korean ballistic missile force exist but vary by a factor of several depending on which systems are counted, so putting any one of them on an axis next to a Chinese launcher count would lend it a precision it does not have.
Drawing a zero bar for either actor would assert a claim. Leaving the space empty reports what is actually knowable.
Why the two panels are never combined
Four reasons, and each is sufficient on its own.
The systems do not substitute. A Patriot cannot engage a high altitude threat, a THAAD is not a fleet air defence system, and an SM-3 is bought in small numbers because the missiles it intercept are themselves rare. Counting interceptors as one undifferentiated pile loses the only information that matters about which layer is thin.
The sides are measured differently. American rates come from contract announcements and from reporting at named plants. Chinese counts come from a Pentagon assessment. Russian counts come from an adversary's military intelligence. These are not the same quality of observation, and treating them as one series imports a false precision into the comparison.
The dates do not match. The American rates are current. The Chinese count is from December 2025. The Russian counts are from July and August 2026. A chart that lines these up as though they describe one moment is describing a moment that never existed.
And the denominator question has no public answer. Deciding whether production is enough would require knowing how many interceptors a conflict consumes, how quickly they are fired, and what the opponent would send. The first of those is unknowable in advance and the second is a planning assumption rather than a measurement.
Keeping the chart current
Every figure lives in one file, data/interceptors.json, and each entry carries five things: the value, the unit, the date it was measured, the body that estimated it, and a source link. Nothing is hardcoded in the renderer. When a new procurement figure lands, you change the value in that file, rerun scripts/make-interceptor-chart.py, then rebuild and deploy.
Two rules govern what may be added. The first is that no figure enters without all five fields, which means every number on the chart can be traced back to whoever measured it and when. The second is that panel B accepts only a counted stock or a launcher count. Percentages, warhead estimates and scenario figures stay out of the bar axis, because mixing units on one scale is the same error as dividing across the two panels.
The renderer checks its own geometry before it writes anything. If two blocks of the chart would overlap, or if the content would run into the source line, it exits with an error naming the offending block instead of saving a broken image. Adding a sixth adversary therefore fails loudly if it does not fit, which is the behaviour you want from something meant to be updated rather than redrawn.
What would change the reading
The most consequential thing that could arrive is a published US interceptor inventory. It would replace an inference with a measurement and would let the top panel show holdings rather than output. Nothing else in the public record would improve the chart as much.
On the other side, a Pentagon assessment that published North Korean launcher counts would fill the largest gap. A fourth-party verification arrangement that allowed inspection of Iranian launchers would do the same for Tehran. Both are the kind of change that happens by policy decision rather than by analysis, which is the honest reason this chart has two empty rows and expects to keep them.