
The World Trade Organization's October update, released on 8 October, raised its forecast for world merchandise trade volume growth in 2026 to 3.9 percent. In March it had projected 1.9 percent. The revision is the largest single upgrade the organisation has made in recent years, and it was driven by two forces the forecast does not name in its headline: demand for AI-related goods, and the adaptation of supply chains to routes that no longer run through the Gulf.
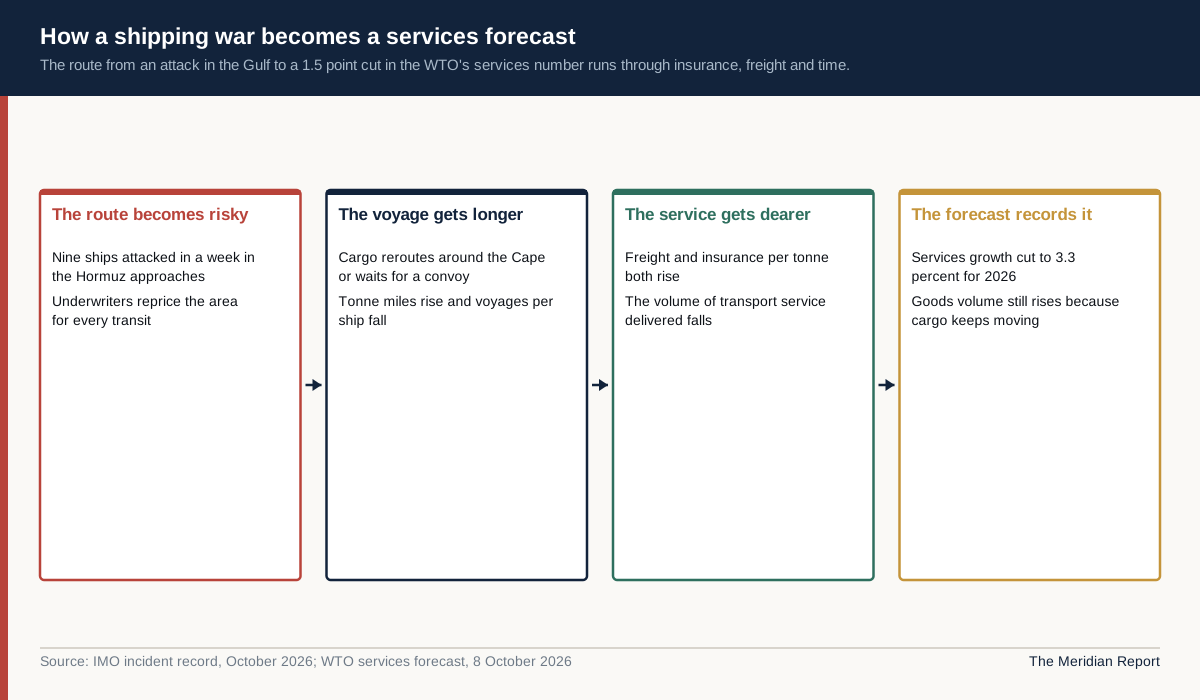
In the same release, the WTO cut its forecast for commercial services trade in 2026 to 3.3 percent from 4.8 percent. Services include transport, travel, insurance and logistics, which is where a shipping war is actually booked. The goods forecast moved up by 2 percentage points and the services forecast moved down by 1.5 points, and the distance between them is the most useful thing in the release.
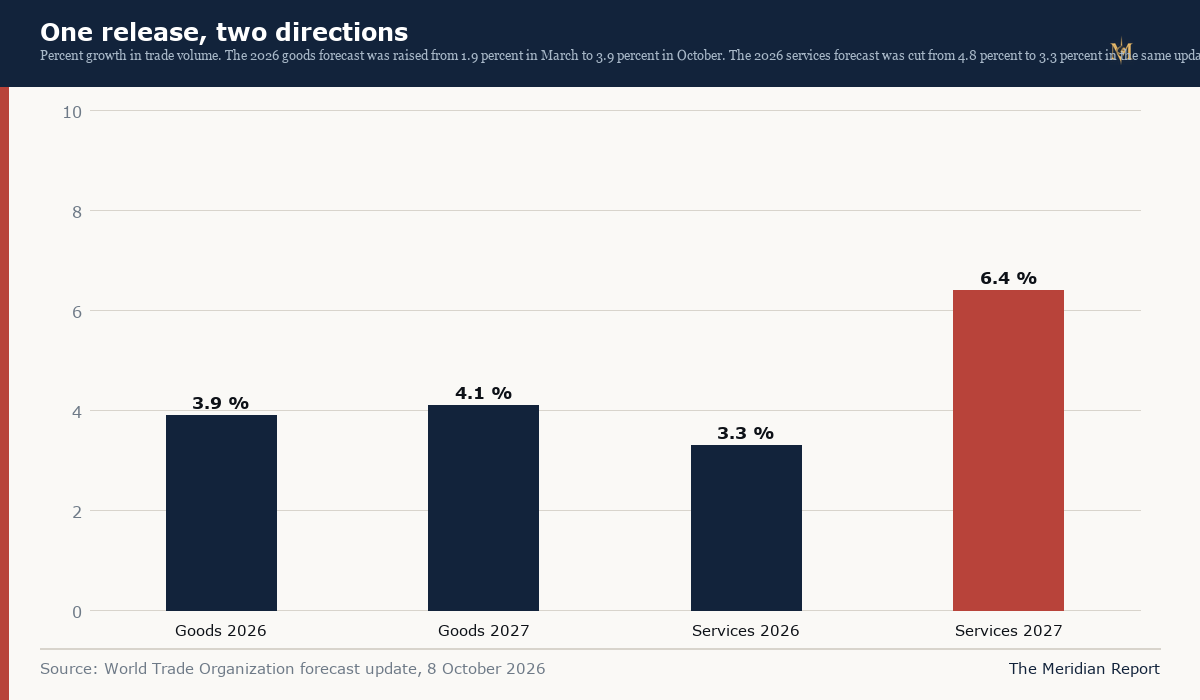
Two numbers moving in opposite directions are not a contradiction. They are a description of an economy in which the physical volume of goods is being pulled by one investment cycle while the cost and availability of moving them is being pushed by a war. The WTO's chief economist made the point in a different register on 15 October, when she said the Middle East conflict would leave a lasting mark on trade even after the immediate disruption eased. A forecast can be upgraded and a system can be damaged at the same time.
Two forecasts, one release
The March baseline of 1.9 percent was written when the war was a month old and the Strait of Hormuz had effectively closed. At that point the reasonable assumption was that the loss of the Gulf's oil and gas exports would drag goods trade down through higher energy costs, weaker demand and disrupted shipping. The October update revised that assumption because the first half of the year produced more trade than the model expected.
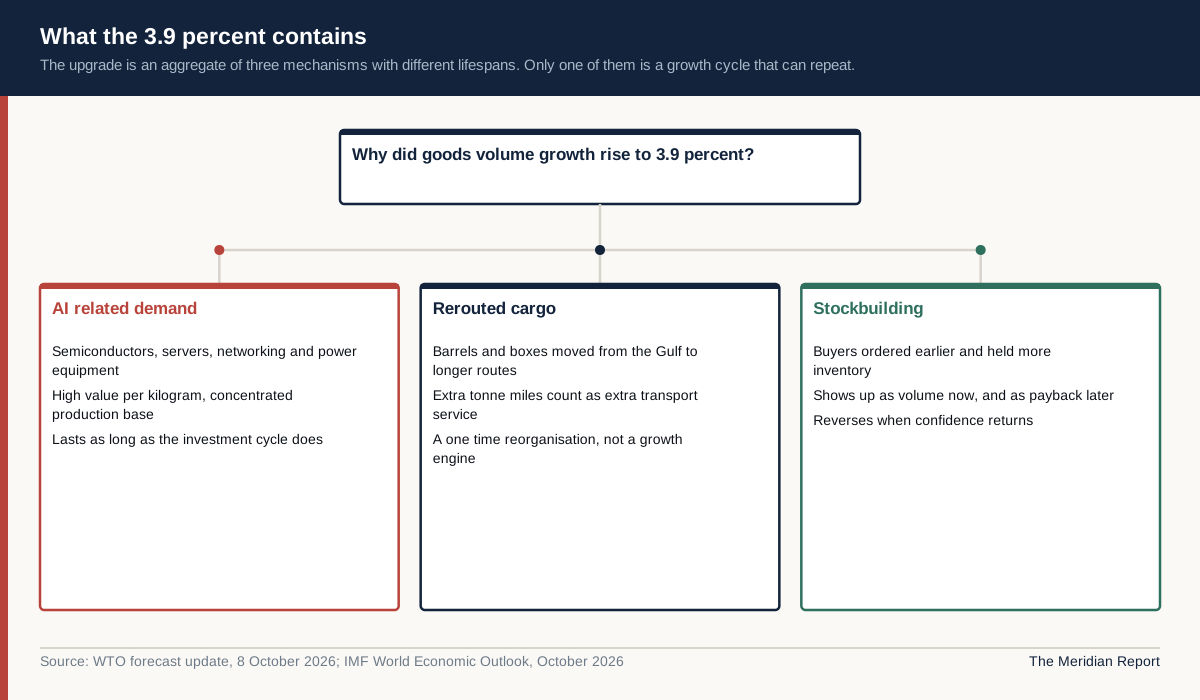
The revision is not a claim that the war was mild. It is a claim that the rest of the world traded through it. The WTO attributes the strength to AI-related demand and to supply-chain adaptation, which are two different mechanisms with two different lifespans. AI demand is an investment cycle: it lasts as long as firms believe the returns justify the capital. Supply-chain adaptation is a one-time reorganisation: once a cargo has been rerouted, the rerouting does not produce further growth, it produces a new cost base.
That distinction matters for 2027, when the WTO projects goods volume growth of 4.1 percent. A forecast that rises from 1.9 to 3.9 in one year and then to 4.1 the next implies that the drivers persist. If the 2026 upgrade came mostly from rerouting, the 2027 number is carrying a growth assumption that the rerouting cannot repeat.
The services side tells the opposite story in the same period. Commercial services trade was forecast to grow 4.8 percent in 2026 in the earlier round. It is now 3.3 percent, and the 2027 projection is 6.4 percent, which implies a recovery rather than a permanent shift. The cut is concentrated in the transport and logistics components that a war taxes directly, and the recovery assumes that the war's effect on routes fades.
Why goods trade beat the March baseline
Three mechanisms can produce a goods volume upgrade in the middle of an energy shock, and they leave different fingerprints.
The first is price. A volume forecast strips out price changes, so a world paying 110 dollars for Brent is not automatically trading fewer barrels. If demand for oil is inelastic in the short run, the quantity of oil traded can hold up while its value rises. The volume measure then records resilience at the same time as the value measure records a transfer of income from importers to exporters. The WTO's 3.9 percent is a volume number, and it is compatible with a much worse outcome in value terms.
The second is substitution. A cargo that used to move through the Gulf can move from the Atlantic, the Americas or West Africa instead. The substitution adds tonne-miles, which is itself a form of trade growth: the same barrel travelling further is more transport service, more fuel and more insurance. The volume of goods can rise because the distance they travel has risen, even if the quantity consumed has not.
The third is stockbuilding. When firms expect disruption, they order earlier and hold more. Front-loaded orders show up as trade volume in the period before the disruption bites, and they show up as a payback later. The first half of 2026 gave firms a strong reason to front-load, and the October forecast covers exactly that period.
Each of these mechanisms is real, and each is temporary in a different way. Substitution persists as long as the war does. Stockbuilding reverses. Front-loading pulls demand forward and leaves a hole behind it. A forecast built on all three is a forecast that assumes the war continues without getting worse, because a worsening would force another reorganisation and a cessation would allow the cheap route to return.
The AI cargo is heavy in value and narrow in base
The WTO's own explanation puts AI-related demand first. That is a specific claim about the composition of trade, and it deserves more scrutiny than the headline.
AI infrastructure is a narrow set of products: advanced semiconductors, servers, networking equipment, power equipment and the components that go into data centres. These goods are high in value per kilogram, which means a modest increase in their physical volume can produce a large increase in the value of trade without moving many ships. They are also concentrated in a small number of production locations and a small number of destination markets, which makes the trade flow sensitive to a handful of corporate capital expenditure decisions.
The concentration is the risk. The IMF's October outlook lists a reassessment of AI expectations as one of four downside risks to global growth, alongside further conflict escalation, renewed trade tensions and fiscal vulnerabilities. If the AI investment cycle slows, the component of goods trade that offset the energy shock slows with it. The WTO forecast and the IMF risk assessment are describing the same dependency from opposite ends: one measures the benefit while it lasts, the other names what happens when it stops.
There is a second, subtler problem. AI hardware is a capital good, not a consumer good. A data centre built in 2026 does not need to be built again in 2027, and the trade that supplied it is a one-time flow unless demand keeps growing. The 2027 forecast of 4.1 percent therefore assumes either that the AI build-out continues at a similar pace or that other categories of goods take over the growth. Neither is guaranteed, and the release does not say which it expects.
What the Middle East lost
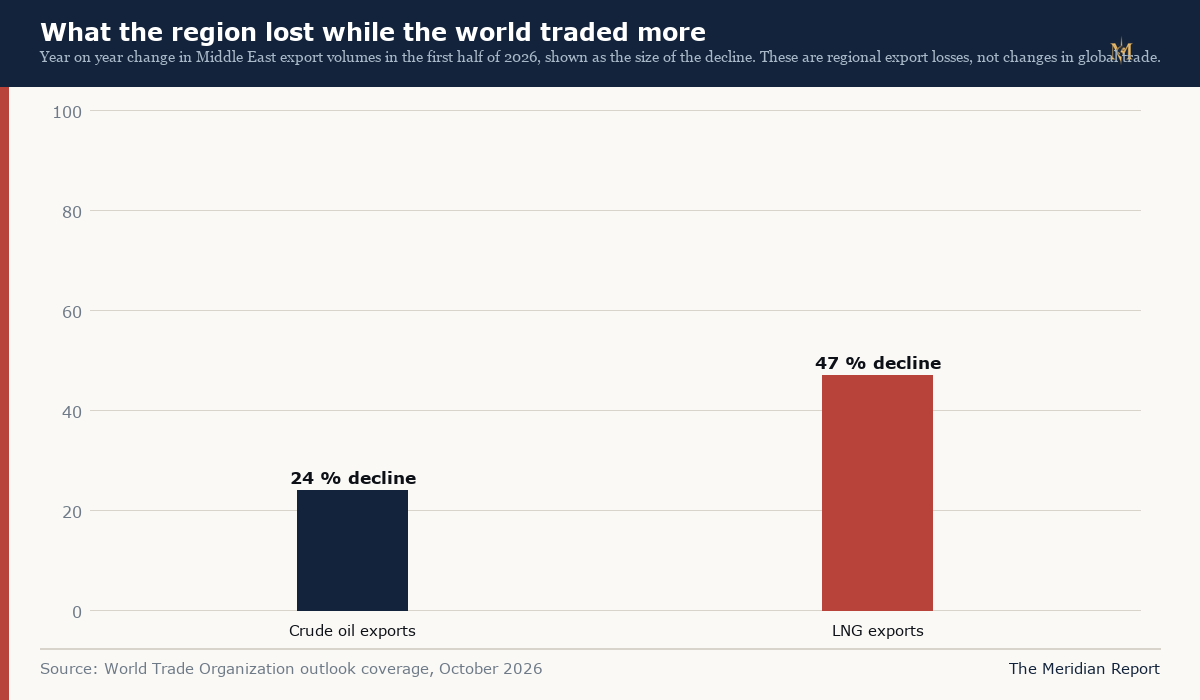
The regional figures are the part of the release that the global number conceals. Middle East crude oil exports fell 24 percent year on year in the first half of 2026, and LNG exports fell 47 percent. Those are volume declines in the two products the region exists to export, and they happened while global goods trade was beating its forecast.
A 24 percent fall in crude exports from the Middle East is not a small event in absolute terms. The region exports in the region of 20 million barrels a day in normal conditions, so a decline of that size removes close to 5 million barrels a day from seaborne trade. A 47 percent fall in LNG is proportionally even larger, because LNG cannot be rerouted as flexibly as crude: it needs liquefaction at one end, regasification at the other, and ships that are booked years in advance.
The global volume figure absorbs these losses because oil and gas are a declining share of trade by value in an economy dominated by manufactured goods and services, and because the losses were offset elsewhere. But absorption is not compensation. The exporter that cannot load a cargo loses revenue, the importer that must buy elsewhere pays more, and the shipping system that reroutes the cargo earns more. The global number adds those up and reports a rise.
This is the arithmetic that makes trade forecasts politically misleading. A country whose exports fell by a quarter is not consoled by a global average that rose because other countries traded more. The WTO's 3.9 percent is an average, and the distribution around it is where the war's cost sits.
Services are where the war is booked
The 1.5 point cut to services is the more honest number in the release, because services are where the physical disruption is recorded. Transport is a service. Insurance is a service. Logistics, port handling, crew management and shipbroking are services. When a strait becomes dangerous, the volume of those services falls and the price of some of them rises, and the two effects do not cancel.
Insurance is the clearest case. A war risk premium that rises from 0.125 percent of hull value to 7.5 or 10 percent is a price increase for a service that is still being provided. In national accounts, the value of insurance services can rise even as the volume of cover falls, because the premium is the measure. A trade forecast that tracks volume will understate the cost increase, and a forecast that tracks value will overstate the resilience.
Transport is the mirror image. Rerouting a cargo around the Cape of Good Hope adds thousands of nautical miles and weeks of transit. The freight revenue per voyage rises, the number of voyages per ship per year falls, and the effective capacity of the fleet shrinks. The volume of transport services measured in tonnes carried can fall while the revenue rises. Services trade statistics struggle with this, which is one reason the WTO's services forecast is less precise than its goods forecast.
The cut to 3.3 percent is therefore not a prediction that the world will buy fewer services. It is a recognition that the services most exposed to the war are being consumed in smaller quantities at higher prices, and that the net effect on the volume measure is negative. The 2027 rebound to 6.4 percent assumes the routes normalise enough for the volume to recover. That is a stronger assumption than the goods forecast makes.
Volume is not value, and 4.7 percent inflation is the difference
The IMF's October outlook, published five days after the WTO release, projected global growth of 3.1 percent in 2026 and global headline inflation of 4.7 percent. The combination is the context in which the trade numbers should be read.
If world trade volume grows 3.9 percent and prices rise 4.7 percent, the nominal value of trade grows by roughly 8.6 percent, before any change in the composition of what is traded. That is a very different picture from the headline. Importers are paying about 8.6 percent more for about 3.9 percent more goods, which means the average price per unit of traded goods has risen. The volume forecast is good news about quantity and bad news about cost, and the two are reported in different documents.
The distribution of that cost is not uniform. An energy importer with a weak currency pays more for the same barrel and has less room to substitute. The IMF identifies energy-importing economies outside the technology value chain as facing the most difficult outlook, which is a precise way of saying that the countries benefiting from the AI cycle are not the countries paying most of the energy bill.
The inflation number also changes what counts as growth. A country whose nominal trade grows 9 percent while its currency depreciates and its import prices rise 12 percent is worse off, even though the trade value rose. Volume forecasts are the right instrument for capacity and logistics planning. They are the wrong instrument for welfare, and the WTO release is a capacity document.
The barrier no tariff schedule captures
A trade forecast normally worries about tariffs, quotas and rules of origin. The 2026 version has to worry about a cost that appears in none of those instruments: the price of moving a container from one port to another when the shortest route is contested.
Freight is a tax on distance, and distance is the one variable a trader cannot negotiate away. A carrier that reroutes around the Cape of Good Hope adds roughly 3,400 nautical miles to an Asia to Europe voyage, which is about ten days at a service speed of 14 knots and a great deal more fuel. The added cost is real, and it is paid before the goods reach a customs officer. It does not show up in a tariff line, it does not require a vote in any parliament, and it cannot be waived by an executive order.
Insurance is the same kind of barrier with a different name. A war risk premium is a charge for crossing a particular body of water, set by underwriters who are pricing the probability that a ship is hit. When the premium rises from about 0.125 percent of hull value to 7.5 or 10 percent, the cost of the voyage changes by an amount that can exceed the entire freight rate. The importer pays it through the delivered price, and the exporter absorbs it through a lower netback, and the government that set the tariff sees none of it.
This is why the WTO's goods forecast can rise while the cost of trading rises faster. The volume measure records the cargo that still moves. It does not record the cargo that was priced out, the marginal shipment that was cancelled because the freight exceeded the margin, or the buyer who switched to a domestic supplier because the delivered cost became unpredictable. Those effects show up in the value data and in the services data, not in the volume headline.
There is a further asymmetry. The ships that can absorb the risk are the large, well-insured, coalition-flagged vessels, and the shippers who can absorb the cost are the large, well-capitalised traders. Small exporters in emerging markets face the same premium with a smaller balance sheet, which means a shipping war consolidates trade in the hands of the firms best able to finance it. The 3.9 percent average can be consistent with a sharp fall in the number of firms participating in trade, and that is a loss that no volume aggregate captures.
The countries in between
The distribution of the year's trade performance is starker than the global average. The IMF's October outlook projects growth of 2.1 percent in advanced economies and 3.7 percent in emerging market and developing economies in 2026, with China at 4.5 percent, India at 7.0 percent, Latin America at 2.3 percent and sub-Saharan Africa at 4.5 percent. The euro area is projected at 1.1 percent.
The Middle East and North Africa is the outlier in the other direction. Reuters reported the IMF's regional forecast at a 1.3 percent contraction in 2026, followed by an uneven rebound in 2027. That is what a terms-of-trade shock looks like when the export infrastructure is inside the war zone: the region is not just paying more for imports, it is unable to sell what it produces.
The countries in between are the energy importers outside the technology value chain, which the IMF singles out as facing the most difficult outlook. They pay the higher oil price, they pay the higher freight cost, they do not manufacture the AI hardware that is driving the goods forecast, and they typically have less fiscal room to cushion the shock. Their trade volumes may hold up, because they still need to import food, fuel and intermediate goods, but their trade balances deteriorate and their currencies come under pressure. A volume forecast that aggregates them with the AI exporters hides the divergence.
This is the group that the WTO's services cut describes most accurately. A tourist economy in the eastern Mediterranean, a textile exporter in South Asia or a container port in East Africa earns its foreign exchange from services and from labour-intensive goods, both of which are sensitive to transport costs and to the confidence of buyers. When insurance premiums rise and routes lengthen, those economies lose competitiveness before they lose volume, and the loss is not reversible simply because the war pauses.
The forecast assumes no tariff shock
The WTO's October update was published ten days before a tariff decision that could change its assumptions. On 16 October the White House issued an executive order implementing the Lindsey O. Graham Sanctioning Russia and Iran Act of 2026. The order set a 500 percent ad valorem duty on goods from Russia and a 100 percent duty on goods from the five largest importers of Russian crude and gas, effective for new purchases on or after 18 October, and then waived the duties under the Act's waiver provision.
The waiver means the tariffs are not currently being collected. It does not mean the risk has gone. A duty that is written into law, scheduled for a date, and suspended by a presidential certification can be reinstated by another determination. For a trader deciding where to source next year, the relevant fact is not whether the tariff is live today. It is that the legal authority exists and the trigger is a political decision rather than a legislative one.
A 100 percent duty on goods from the largest importers of Russian energy would not be a targeted sanction. It would be a tariff on the economies that kept Russian oil flowing while the coalition's price cap was in place, and those economies are also major participants in the goods trade that the WTO just upgraded. The overlap is the problem: the countries whose trade would be taxed are the countries whose trade has been holding the forecast up.
The WTO release does not model this. Its forecast assumes the trade policy environment of early October, and its own risk list includes renewed trade tensions. A reader should treat the 3.9 percent as the number that holds if the waivers hold, and the 1.9 percent March baseline as a reminder of how quickly the organisation will revise if they do not.
What would make the forecast wrong in the other direction
The forecast has an upside that the release mentions but does not quantify. If the war ends, the Strait of Hormuz reopens on commercial terms and the insurance market reprices the Gulf downward, the cost of trade falls faster than the volume rises. The same mechanism that amplified the shock on the way up would amplify the recovery on the way down.
A durable settlement would do three things at once. It would restore the short route, which would cut tonne-miles and freight. It would allow the insurance premium to fall, which would cut the delivered cost of every cargo through the region. And it would reduce the incentive to hold inventory, which would reverse some of the stockbuilding that flattered the 2026 volume number. The first two are unambiguously positive for trade. The third is ambiguous: destocking reduces measured trade volume while improving the balance sheets of the firms that hold the stock.
That is why a trade forecast is a poor guide to a peace dividend. The volume number can fall as the economy becomes more efficient, because firms stop holding three months of inventory and start holding three weeks. The 2027 projection of 4.1 percent assumes a world that is still paying the war's costs and still holding the war's buffers. A settlement could produce a better economy and a lower trade volume, and the headline would record the second without the first.
The services forecast captures the upside more directly. A reopening would restore transport volumes, lower insurance costs and revive travel, which is why the 6.4 percent projection for 2027 is so much higher than the goods number. If the settlement arrives earlier than the forecast assumes, services could beat it. If it arrives later, the gap between the two forecasts widens in the other direction.
What 2027 requires
The 2027 goods forecast of 4.1 percent is higher than the 2026 number, which is unusual for a year that follows a supply shock. Recoveries normally produce a bounce and then a slowdown, not two consecutive years of accelerating volume growth. The forecast therefore implies that the drivers of 2026 are not one-time events.
Three conditions would have to hold. The AI investment cycle would have to continue at a pace close to 2026, because the goods that carried the upgrade are the goods that would have to carry the next one. The energy shock would have to stop getting worse, because a second closure or a successful strike on the Saudi pipeline would force another reorganisation and another cost increase. And the tariff waivers would have to hold, because a 100 percent duty on the largest energy importers would tax a substantial part of the goods trade the forecast is counting on.
None of those conditions is impossible. All three are political or corporate decisions rather than physical constraints, which is what makes the forecast fragile. A trade forecast is a statement about the behaviour of firms and governments, not a law of nature, and the WTO's own risk section says so.
The 6.4 percent services forecast for 2027 makes an even stronger assumption. It requires the war's effect on transport and insurance to fade, which requires the routes to normalise, which requires a settlement that had not been reached by 17 October. The gap between the goods and services forecasts in 2027, 4.1 against 6.4, is the release's implicit bet that services recover faster than goods because they have further to fall. That bet is reasonable in a normal cycle. It is less reasonable when the services are being suppressed by an active campaign against shipping.
What the record does not establish
The record does not establish that AI demand caused the entire upgrade. The WTO attributes the strength to AI-related demand and supply-chain adaptation, without publishing the decomposition. A forecast revision is the product of a model, and the model's attribution is an estimate rather than a measurement.
The record does not establish the value of trade. The 3.9 percent is a volume measure, and the release does not provide a matching value forecast. Any statement about how much money is moving through the system is an inference from the volume number and the inflation number, not a figure from the release.
The record does not establish that the Middle East export declines were caused solely by the war. The 24 percent crude and 47 percent LNG figures are year-on-year changes in the first half of 2026, and they coincide with maintenance, investment decisions and the broader reorganisation of energy flows. The war is the dominant explanation, but the release does not isolate it.
The record does not establish that the waiver of the Graham Act duties will last. The executive order says the waivers remain in effect until the President or the Secretary of State determines further action is appropriate. That is an open-ended commitment, and the 18 October trigger date for new purchases sits inside the forecast period.
What the release established
The release established that the world traded more goods in 2026 than the WTO expected in March, and that it traded fewer services. It established that the two halves of the trade system are being driven by different forces, and that the forces have different clocks. It established that a war can reduce the exports of a region by a quarter and still leave the global volume average higher, because the average is not a welfare measure.
The most useful reading is not the 3.9 percent. It is the 1.5 point cut to services, because that is where the war is recorded, and the 2 point upgrade to goods, because that is where the AI cycle is recorded. A reader who wants to know what happens next should watch the services number. It is the one that will move first if the routes deteriorate, and it is the one that will recover last if they normalise.