
The International Monetary Fund's October World Economic Outlook, published on 13 October, projects global growth of 3.1 percent in 2026 and 3.4 percent in 2027. It projects global headline inflation of 4.7 percent in 2026, easing to 4.1 percent in 2027, with core inflation at 3.9 percent and 3.7 percent. The projections use information available through 1 October.
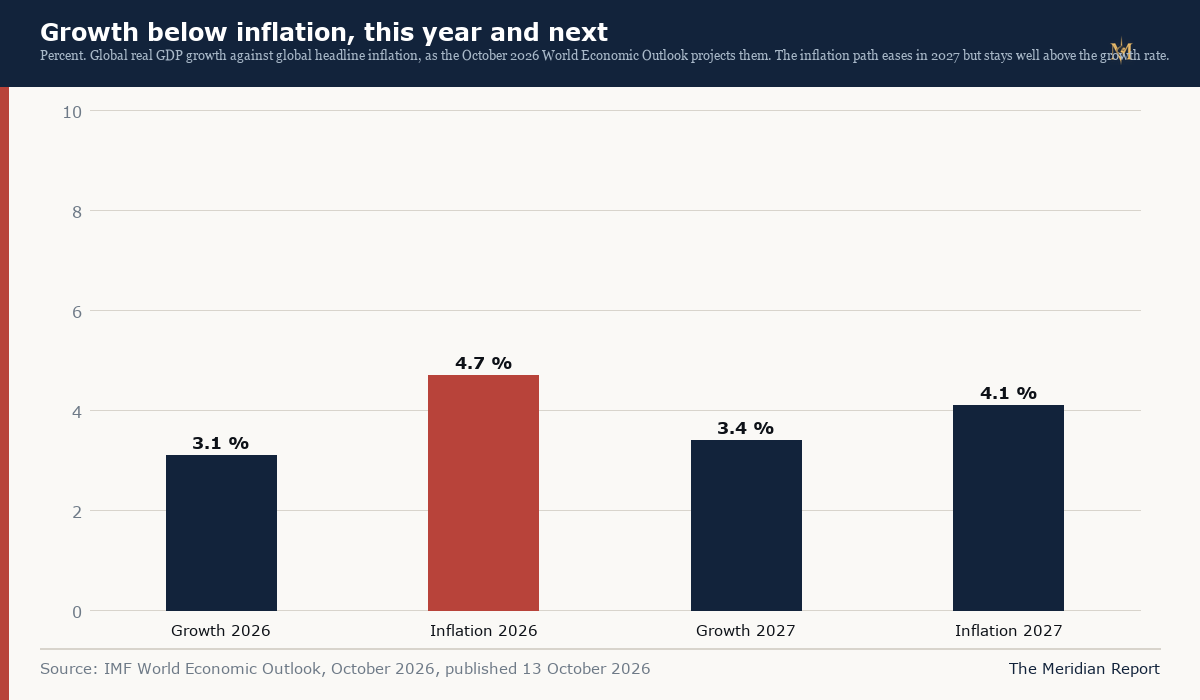
Those numbers describe a world that is absorbing an energy shock without falling into recession. The more consequential finding is buried in Chapter 2, which examines cost-of-living crises and reaches a conclusion with a price attached: measures that suppress prices can require 3 to 22 times more fiscal resources than temporary, targeted transfers that protect the same households.
In a normal year that ratio would be an academic footnote. In October 2026 it is a live policy question for every government that responded to the oil price by holding down the price of fuel, bread or electricity. Energy inflation across the OECD's members ran at 13.6 percent in August, up 2 percentage points from July, and G7 energy inflation was 14.0 percent. Brent settled at 109.86 dollars on 16 October. The cost of the wrong instrument is being paid now, in budgets that were already stretched before the war.
What the October outlook says
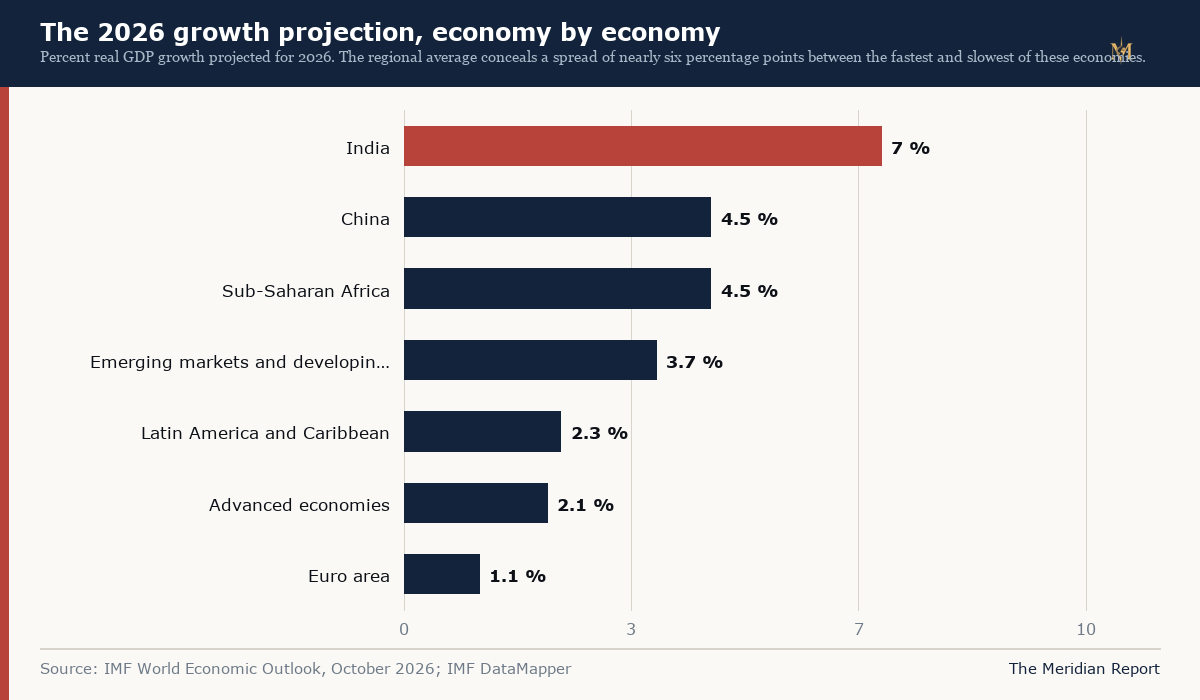
The growth projection is a small upgrade to 2026 and no change to 2027 compared with the July update, which had put 2026 at 3.0 percent. The revision is described as resilience, and the report is careful to qualify what kind. Global growth of 3.1 percent is close to the pre-pandemic trend of the 2010s, but it is not evenly distributed, and the distribution is doing most of the work in the aggregate.
Advanced economies are projected to grow 2.1 percent in 2026 and 1.8 percent in 2027. Emerging market and developing economies are projected at 3.7 percent and 4.4 percent. Within those groups the spread is wider than between them. India is projected at 7.0 percent in both years. China is projected at 4.5 percent in 2026 and 4.0 percent in 2027. The euro area is projected at 1.1 percent in 2026. Latin America and the Caribbean is at 2.3 percent and 2.5 percent, and sub-Saharan Africa at 4.5 percent in both years.
The Middle East and North Africa is the region moving in the opposite direction. Reuters reported the IMF's regional projection at a 1.3 percent contraction in 2026, with an uneven rebound in 2027. A region that exports the commodity at the centre of the shock is contracting because it cannot ship it, which is the clearest single illustration of how a price shock and a volume shock can point in opposite directions.
The inflation projection also carries a qualification. The IMF says inflation has been revised cumulatively upward, and the accessible summary does not quantify the earlier forecast, so the size of the revision is not established by the report's headline. What is established is the direction and the level: 4.7 percent headline for the year, with core above 3.5 percent, is not a disinflation path. It is a plateau.
The finding that matters: 3 to 22
The Chapter 2 finding deserves to be quoted precisely. The IMF says that during cost-of-living crises, governments should preserve price signals and rely primarily on temporary, targeted income support for the most vulnerable, and that measures which suppress prices are much more costly, requiring 3 to 22 times more fiscal resources than targeted, temporary transfers.
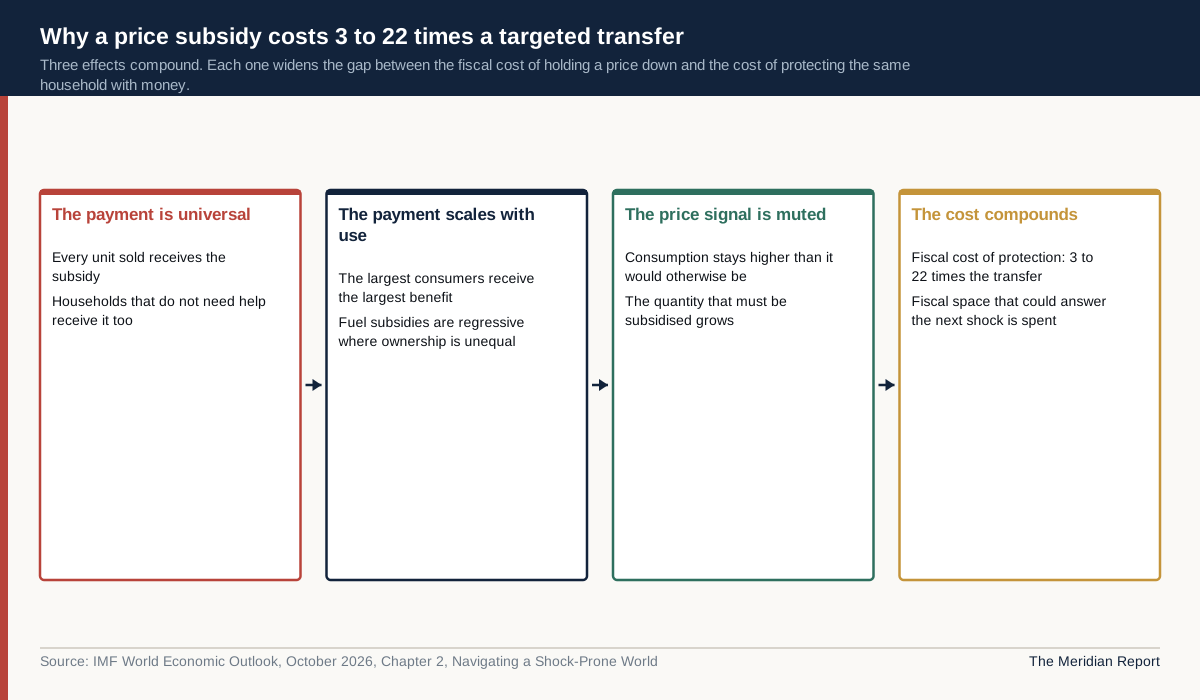
The ratio is a comparison of fiscal cost per unit of household protection. If a government wants to shield a household from a 20 percent increase in the price of the fuel it buys, there are two ways to do it. It can hold the price down by paying the difference to the seller, in which case every unit sold receives the subsidy, including the units bought by households that do not need help. Or it can transfer cash to the household and let the price rise, in which case the household receives the same protection and the government pays only for the households it chose.
The first approach is more expensive for three reasons that compound. The subsidy is universal, so the payment goes to rich and poor alike. The subsidy is per unit, so it grows with consumption, and high-consumption households receive more. And the subsidy distorts the price signal, so consumption stays higher than it would otherwise be, which increases the quantity that has to be subsidised. The 3 to 22 range describes how much those three effects cost in different episodes, with different subsidy designs and different consumption patterns.
The lower end of the range, 3 times, is the best case: a well-targeted subsidy with a low fiscal multiplier and a modest distortion. The upper end, 22 times, is the case where the subsidy is broad, the price gap is large and the consumption response is strong. The width of the range is itself a finding, because it means the cost of the wrong instrument depends on design choices that governments control. A badly designed price cap is not merely expensive. It is many times more expensive than a well-designed one.
Why the range is so wide
Three variables set where a country lands between 3 and 22.
The first is coverage. A subsidy on a single staple bought mostly by low-income households is closer to a transfer than a subsidy on petrol, which is bought disproportionately by the better off in most developing economies. The closer a fuel is to a luxury, the more regressive a price subsidy becomes, and the wider the gap against targeted cash.
The second is the size of the price gap being closed. If the world price rises 60 percent and the government holds the domestic price flat, it is paying 60 percent of the world price on every unit. If it lets the price rise gradually while compensating households, the fiscal cost is the compensation, not the gap. The 3 to 22 range probably captures both a modest gap and an absolute one, which is why it spans an order of magnitude.
The third is the duration. A temporary subsidy during a price spike is a smoothing device. A subsidy that persists after the spike becomes a permanent transfer with a permanent fiscal cost, and it becomes politically difficult to remove precisely because it has been capitalised into household budgets. The IMF's emphasis on temporary and targeted is aimed at this dynamic. A temporary measure can be wound down; a permanent one requires a political crisis to end.
There is a fourth factor that the summary does not name but that appears in the fiscal arithmetic: the multiplier. A transfer to a low-income household is likely to be spent, which supports demand and therefore tax revenue. A subsidy to a fuel seller may be saved or remitted abroad, especially if the fuel is imported. The net fiscal cost is the gross cost minus whatever comes back in tax, and the difference between the two instruments on that margin can be substantial.
The capacity problem that makes subsidies rational
The IMF's recommendation is correct in the arithmetic and difficult in the administration. Targeted transfers require a registry of households, a payment system, an eligibility rule and an appeal process. Countries with mature tax and social security systems have all four. Countries that subsidise fuel heavily are often the countries that have none of them.
This is the honest counter-argument to the report, and the report does not fully engage with it. A government with no household registry cannot deliver targeted cash this quarter. It can deliver a price subsidy this afternoon. The choice it faces is not between an efficient instrument and an inefficient one. It is between an inefficient instrument and no protection at all, and the political cost of the second is usually higher than the fiscal cost of the first.
That does not rescue the subsidy. It relocates the problem to institution building, which is slow, and to the design of second-best measures that approximate targeting without a registry. Universal subsidies on goods consumed mostly by the poor, such as subsidised bread or public transport, are closer to targeted transfers than a petrol subsidy, and they cost less. Subsidies capped by quantity per household, if the delivery system can enforce a cap, are closer still.
The IMF's own framing points at this: preserve price signals and support incomes. Where the income support infrastructure does not exist, the practical version is to build it while choosing the least regressive price measure in the interim. The 3 to 22 ratio tells a finance ministry how much the interim is costing. It does not tell it what to do by Friday.
How energy becomes headline inflation
The OECD's August data shows the transmission mechanism in one release. Headline inflation across OECD members was 4.3 percent, up from 4.1 percent in July. Energy inflation was 13.6 percent, up 2 percentage points from July, and G7 energy inflation was 14.0 percent, up 1.8 points.
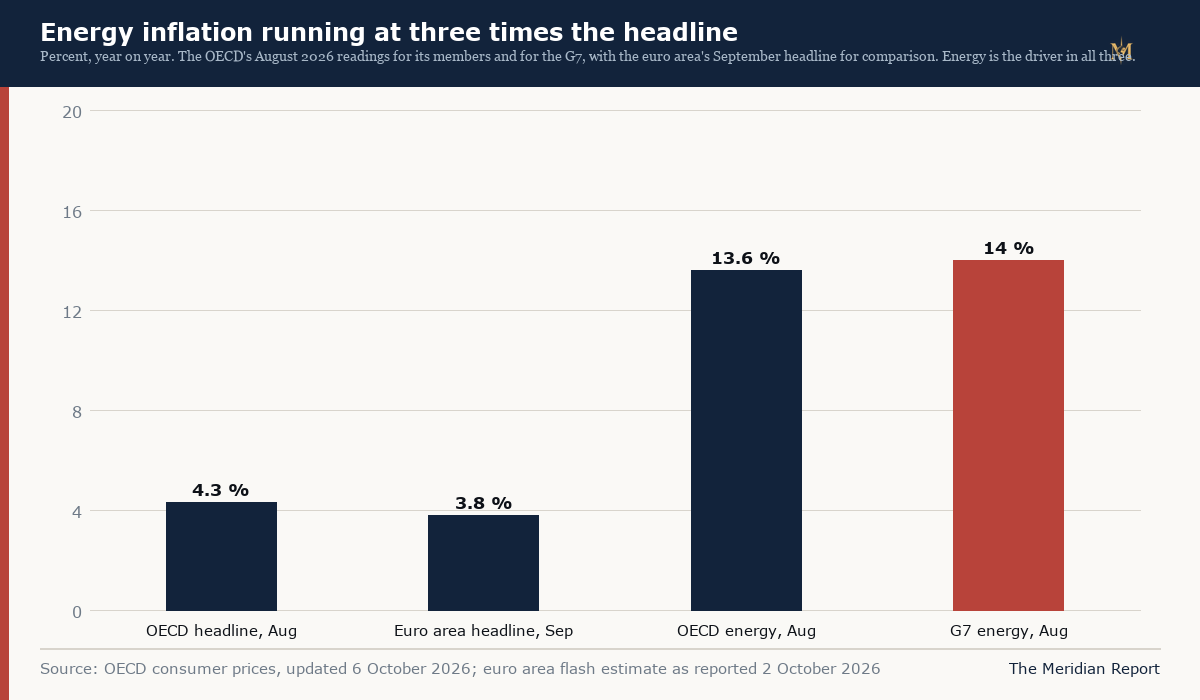
The contribution of energy to headline inflation depends on its weight in the consumption basket, which is typically between 7 and 10 percent across advanced economies. At a 13.6 percent energy inflation rate and a 9 percent weight, energy contributes about 1.2 percentage points to headline. That is the difference between inflation at 4.3 percent and inflation at 3.1 percent, and it is roughly the difference between an inflation rate that is falling toward target and one that is stuck above it.
The arithmetic also explains why central banks are reluctant to look through the shock. A one-off increase in the price level is not inflation once it has happened, and central banks normally tolerate it. But the IMF's concern is the second round: if workers and firms expect the energy price increase to persist, they build it into wages and contracts, and the one-off becomes a process. Core inflation at 3.9 percent in the IMF's forecast is the evidence that the process is already visible. Energy is not in the core measure, and core is still well above target.
The distributional effect works in the opposite direction to the usual one. Energy is a larger share of household budgets for poorer households, so a 13.6 percent energy price increase is regressive in consumption terms, even when the subsidy that cushions it is regressive in fiscal terms. That combination, regressive shock plus regressive instrument, is the trap that the report's 3 to 22 finding is designed to break. A targeted transfer is the only instrument that is progressive on both sides.
The euro area is the test case
The euro area is running the experiment in public. Inflation rose to 3.8 percent in September from 3.2 percent in August, with energy among the drivers. The European Central Bank's target is 2 percent, which means the gap is 1.8 percentage points, and a substantial part of it is imported energy.
Two ECB policymakers described the dilemma within three days of each other. Olli Rehn said on 2 October that inflation could approach 4 percent by the end of the year, and argued that higher yields might curb some of the pass-through from energy costs to prices. Philip Lane said on 5 October that higher energy costs, rising yields and shrinking budget support could weigh on growth and limit how much further monetary policy might need to tighten.
The two statements are consistent, and they describe a policy problem with no clean instrument. The energy shock raises prices and reduces growth at the same time. Raising interest rates fights the first and worsens the second. Holding rates fights the second and risks the first. The only tool that addresses the shock directly is fiscal, and the fiscal tool that protects households without adding to demand is a targeted transfer, which is the IMF's recommendation.
Rehn's point about yields is the most interesting part of the euro area story. Higher long-term yields tighten financial conditions, which reduces demand without the central bank having to raise its policy rate further. If the market is doing the tightening, the central bank can afford to wait. But yields are also a cost to governments, which raises the interest bill precisely when the same government is being asked to protect households from energy prices. The fiscal space that the IMF wants rebuilt is being consumed by the same shock that the fiscal policy is trying to cushion.
Fiscal space is the constraint that binds
The report's policy chapter says fiscal space needs to be urgently rebuilt. That instruction sits in tension with the report's other instruction, which is to protect vulnerable households. Both are correct, and the tension is the point: a government cannot rebuild space while funding a universal price subsidy, and it cannot protect households without spending something.
The arithmetic of the tension is straightforward. Every year of a 3 to 22 times more expensive instrument is a year in which the same protection consumed several times the resources, which means either higher borrowing, higher taxes, lower public investment or a smaller buffer for the next shock. The IMF's projections already assume the shock is absorbed. They do not assume the buffer is rebuilt, because the report says the rebuilding has not happened.
Fiscal vulnerabilities are on the IMF's list of downside risks, which closes the loop. A world with less fiscal space is a world in which the next energy shock is more damaging, because the response is more constrained. The report is telling governments that the cost of this year's response is being paid next year, in the currency of reduced capacity to respond.
There is a distributional version of the same point. Countries with the least fiscal space are typically the energy importers outside the technology value chain that the IMF identifies as facing the most difficult outlook. They cannot borrow cheaply, they have no AI export sector to offset the terms-of-trade loss, and their households spend a larger share of income on energy. The 3 to 22 ratio is highest for the countries least able to afford the subsidy and often least able to build the registry that would replace it.
The buffer that absorbed the first shock is smaller
The IMF's warning about depleted energy inventories is worth turning into an inventory of the buffers themselves, because each one has been used.
The strategic reserve is the most visible. The International Energy Agency's member countries agreed the largest collective release in the agency's history on 11 March 2026, making 400 million barrels available, and 325 million barrels had been delivered by 3 October with 75 million still to come. That is a one-time transfer out of the emergency stock into the market, and it does not refill itself. The barrels that cushioned the first shock are no longer available for the second.
Spare production capacity is the second buffer, and it was already thin before the war because several producers had been holding back supply under agreements. The EIA's October outlook reports production shut-ins averaging 4.5 million barrels a day in the fourth quarter, which is not spare capacity being released but output being lost. The IEA's October report puts 2026 global supply at 100.7 million barrels a day, a decline of 5.8 million barrels a day, which is the physical measure of how much supply the system has lost.
Commercial inventories are the third, and they are the ones the market watches weekly. The EIA reported a commercial crude draw of more than 8 million barrels in the week to 9 October, driven by Hurricane Isaias shutting in Gulf Coast production. Weather-driven draws are temporary, but they land on a stock position that is already lower than normal after a year of disruption.
The fourth buffer is substitution, and it is the one that has worked best. Rerouted cargoes, alternative suppliers and demand adjustment have kept the system functioning at 70 percent of Hormuz crude exports and higher prices. But substitution is a process, not a stock. It has limits set by pipeline capacity, tanker availability and refinery configuration, and those limits are physical. Each of the four buffers is either spent, depleted or close to its engineering maximum, which is why the IMF uses the word amplify rather than absorb when it describes the next shock.
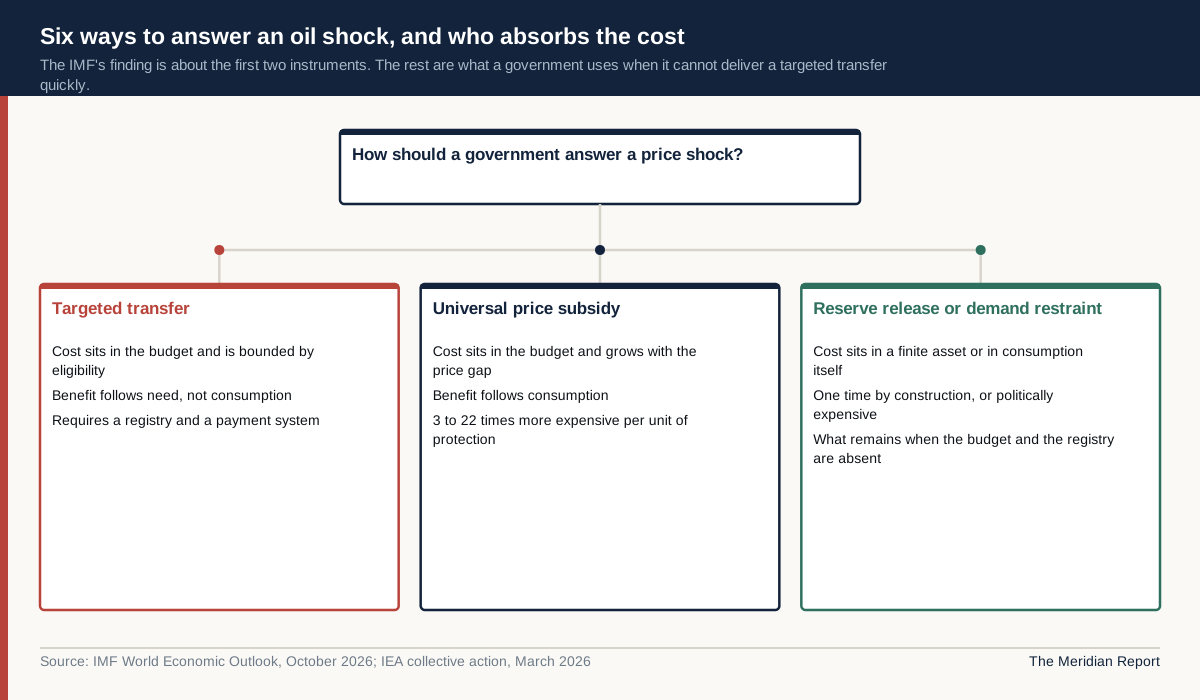
The instrument set, ranked by who pays
A finance ministry responding to the same price shock has a short menu, and the choice within it determines both the fiscal cost and the distribution of the burden. Ranking the instruments by who absorbs the cost makes the trade-offs visible.
An untargeted fuel subsidy absorbs the cost in the budget and distributes the benefit according to consumption, which means the largest benefit goes to the largest consumer. Its fiscal cost scales with the price gap and the quantity consumed, which is the 3 to 22 problem.
A targeted transfer absorbs the cost in the budget and distributes the benefit according to need. Its fiscal cost is bounded by the number of eligible households, and it does not grow when the price rises. Its weakness is administrative, and its weakness is the reason it is not always available.
An excise tax cut on fuel has the same distribution as a subsidy and adds a second problem: it permanently reduces the revenue base at the moment the government most needs revenue. A temporary cut is politically difficult to reverse, and its fiscal cost continues after the price shock ends.
Strategic reserve releases absorb the cost in an asset rather than in a budget line. They lower the price at the margin, they are one-time by construction, and they leave the reserve smaller. Used once, they are a buffer. Used repeatedly, they are a budget that has been moved off the balance sheet.
Demand restraint is the instrument that no government wants to name. Fuel rationing or restrictions on consumption reduce the quantity that has to be supplied, which lowers the price and the fiscal cost simultaneously. It is also the most visible and the most politically costly, and it falls disproportionately on the users with the least ability to adjust, which is why it tends to appear last and only under extreme pressure.
Monetary tightening is not in this menu because it does not protect anyone. It reduces demand in aggregate, which lowers the price over time, at the cost of higher unemployment and slower growth. The euro area's debate is about how much of that instrument is needed when the shock is imported and the fiscal side is constrained.
The IMF's ranking is clear: targeted transfers first, price suppression last. A government that cannot execute the first is choosing between the others, and the 3 to 22 ratio tells it the price of each choice. What the ratio cannot tell it is which choice its politics will allow, and that is the variable that will determine the actual budgets.
The second round is the one to watch
The forecast's path, 4.7 percent in 2026 down to 4.1 percent in 2027, assumes the energy shock does not feed into wages and expectations in a durable way. That is the assumption to monitor, and there are two ways it can fail.
The first is a wage-price spiral in economies where labour markets are tight. Advanced economy growth of 2.1 percent with inflation of 4.7 percent implies real incomes falling, which normally produces wage demands. If those demands are met, services inflation follows energy inflation, and the disinflation path becomes a plateau. The IMF's core projection of 3.9 percent in 2026 and 3.7 percent in 2027 does assume some persistence, so the question is whether the estimate is too optimistic rather than whether the risk exists.
The second is a second energy shock. The IMF notes that depleted energy inventories could amplify future geopolitical price shocks. Inventories were drawn down during the first shock, including the largest collective release in the IEA's history, and the buffer that absorbed the first disruption is smaller than it was. A second disruption would hit a market with less inventory, less spare capacity and less fiscal room, which is the combination the report is warning about without saying it in one sentence.
The pricing on 16 October shows what the market thinks. Brent at 109.86 dollars is above the Energy Information Administration's forecast of about 98 dollars for the 2026 average and 105 dollars for the fourth quarter. The forecast and the market disagree, and the market is pricing the risk of the second shock while the forecast assumes the first one fades.
The upside the report names
The outlook is not only a list of risks. It names three upside possibilities: stronger momentum in AI investment, productivity gains from AI, and a sustained easing of geopolitical and trade tensions. Each has a different mechanism and a different measurement problem.
AI investment is the most immediate. It is already the component of trade that lifted the World Trade Organization's goods forecast to 3.9 percent for 2026 while the same release cut services growth. In the IMF's framework it shows up as demand today and as capacity tomorrow, which is why stronger momentum would raise both growth and the growth potential.
Productivity gains are the more valuable and the slower of the two. An investment boom adds to measured output while it lasts. A productivity improvement changes the trend. The IMF's caution is that the productivity channel has not yet shown up clearly in the data, and a forecast that assumes it prematurely is a forecast that overstates the sustainable path.
An easing of geopolitical tensions is the largest single upside in the report, because it operates on several channels at once: energy prices, shipping costs, insurance premiums, inflation expectations and fiscal space. It is also the least susceptible to forecasting, which is why the report lists it without assigning it a probability. A peace that arrives would improve every number in the outlook. A peace that is delayed would leave the 4.7 percent inflation path intact and the fiscal space unrebuilt.
What the report does not establish
The report does not establish the exact size of the inflation revision. It says inflation has been revised cumulatively upward but does not provide the earlier number in the accessible summary, so a comparison over time is not available from the release.
The report does not establish which countries are using which instrument, or what the aggregate fiscal cost of price suppression has been. The 3 to 22 ratio is derived from episodes in the research literature, not from a survey of current budgets. A reader cannot use it to estimate this year's global subsidy bill.
The report does not establish that energy prices will fall. The 2027 disinflation path assumes the shock fades, and the report's own risk list includes further escalation in conflicts. The forecast is a conditional path, not a prediction.
The report does not establish that targeted transfers are feasible everywhere. It recommends preserving price signals and supporting incomes, and it acknowledges that the recommendation depends on administrative capacity that many energy-importing economies lack. The gap between the recommendation and the capacity is the space in which most actual policy will be made this winter.
What the outlook established
The outlook established that the global economy is growing through an energy shock at a rate close to its long-run trend, and that the growth is concentrated in economies that are not paying the shock's full cost. It established that inflation is the shock's main channel, that energy inflation is running in double digits, and that core inflation has not returned to target.
It established that the fiscal response is the part of the crisis that governments still control. The difference between a targeted transfer and a price subsidy is not a rounding error. It is a factor of 3 to 22, and it is being decided in budget offices this quarter while the war's next phase is decided somewhere else.
The most useful way to read the report is as a warning about sequencing. The IMF wants price signals preserved, incomes supported and fiscal space rebuilt, in that order and at the same time. Governments that can do all three will emerge from the shock with capacity intact. Governments that suppress the price and defer the rebuilding will emerge with the same household protection, a larger debt stock and a smaller cushion for whatever comes next.