
The fiscal year that closed on 30 September 2026 produced 173.219 billion dollars of customs duty, according to the Treasury's September Monthly Treasury Statement. The year before produced 194.866 billion. That is a fall of 21.647 billion dollars, or 11.1 percent, in the first full fiscal year in which the tariff schedule of 2025 was in force for its whole length.
The same twelve months, viewed from the trade side, look different. Census Bureau goods imports for January to August 2026 came to 2,434.8 billion dollars, against 2,337.9 billion in the same months of 2025, an increase of 4.1 percent. BEA put calendar 2025 goods imports at 3,438.4 billion dollars, up 143.2 billion on 2024.
Two series, two directions. The explanation is not that one of them is wrong. It is that a tariff is a tax levied on a base that moves, at rates that are not uniform, collected by an agency that applies a schedule with more exceptions than its headline number suggests. The 11.1 percent decline is the most informative tariff statistic published this year because it is the one that measures what actually arrived at the border and what was actually paid, rather than what a schedule says should happen.
The fiscal year and the calendar year are not the same measurement
Any comparison of duty collections to import values has to survive a calendar mismatch that is easy to miss and fatal to a careless conclusion. The federal fiscal year runs from 1 October to 30 September. The customs duty figures in the Monthly Treasury Statement are fiscal year totals. The import figures that the Census Bureau publishes monthly and the BEA publishes quarterly are calendar values, and their annual totals cover January to December.
A fiscal 2025 duty total of 194.866 billion dollars therefore pairs with imports from October 2024 through September 2025, not with the calendar 2025 import total of 3,438.4 billion dollars. Dividing one by the other produces a ratio that mixes two overlapping but different twelve-month windows, and the error is large enough to matter in a year when the tariff schedule changed part way through.
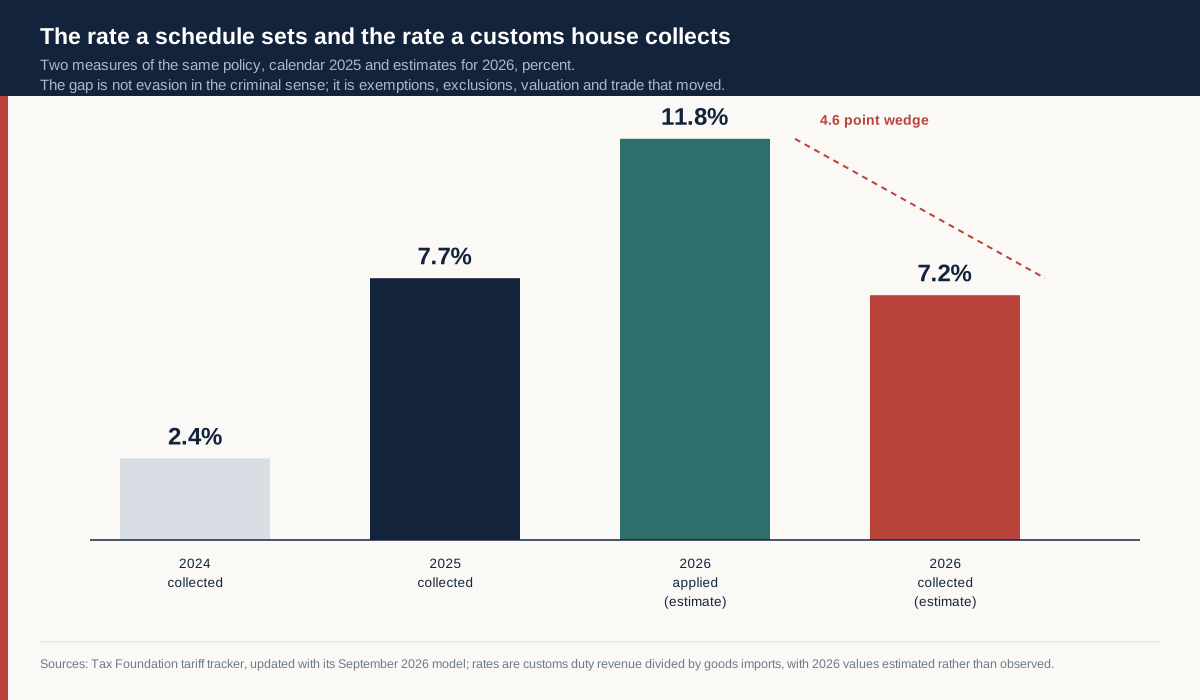
The Tax Foundation's tracker handles this by using recorded calendar-year duty collections against calendar-year imports, which is why its 2025 effective rate of 7.7 percent is not simply the fiscal total divided by an annual import figure. Its method yields 264 billion dollars of duties against roughly 3.4 trillion dollars of goods imports for calendar 2025, and 2.4 percent for 2024. Those two numbers, 2.4 and 7.7, are the cleanest available description of what happened to the tariff burden in a single year.
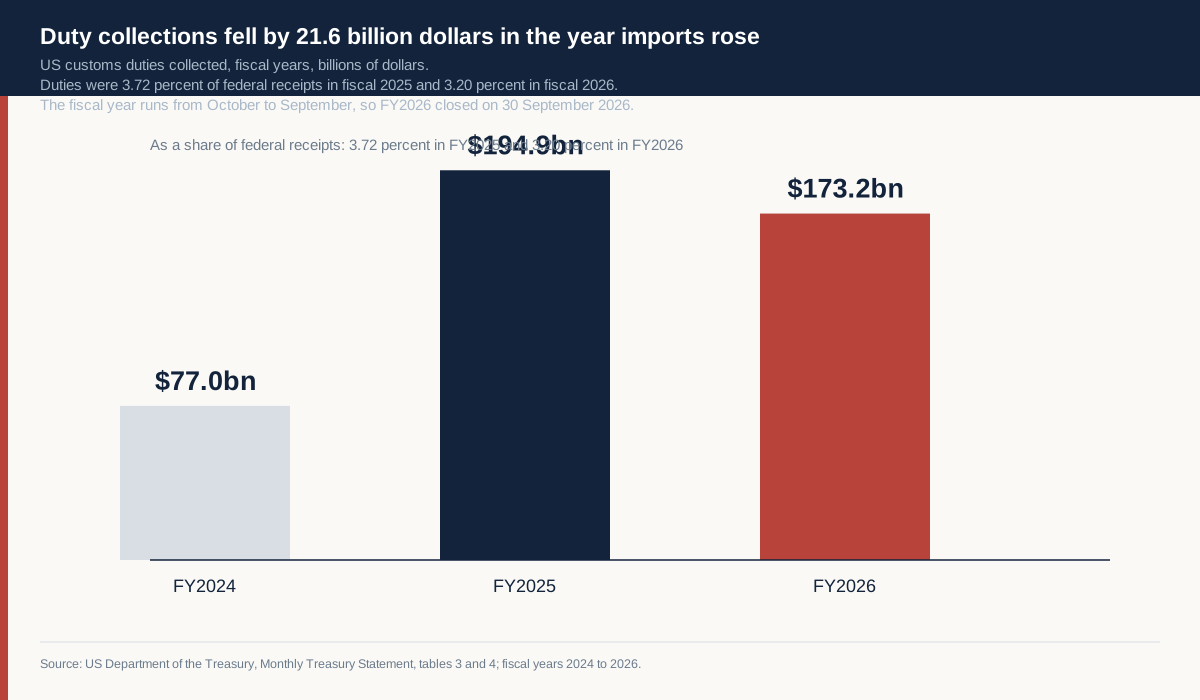
The fiscal-year series is still the right one for a different question, which is what the tariff contributed to the budget. On that measure, the contribution fell. Duties were 3.72 percent of federal receipts in fiscal 2025 and 3.20 percent in fiscal 2026, calculated from the Treasury's own totals of 5,234.6 billion and 5,403.3 billion dollars respectively.
What a 21.6 billion dollar decline can mean
Four mechanisms can produce a fall in duty collections while import value rises, and they are not mutually exclusive.
The first is a change in composition. A tariff schedule taxes categories at different rates, so the revenue depends on what is in the container, not just on how many containers there are. If import growth in a given period came disproportionately from goods that carry a low rate, a zero rate or an exemption, total collections can fall even as total value climbs. The Census data support the value side of that story and say nothing about the mix, which is the limitation of working from totals.
The second is a change in the rate structure. A schedule that is amended during the year, whether by lowering a rate, adding a product to an exclusion list or removing a category from the dutiable base, will produce collections that do not track the original announcement. The 11.8 percent applied rate that the Tax Foundation estimates for 2026 is a weighted average of the rates in force, and it is materially higher than the 7.2 percent effective rate the same tracker estimates. A gap of that size does not arise from rounding.
The third is valuation and classification. Duty is charged on a customs value, and the customs value is declared by the importer and checked by the agency. Changes in declare d value, in the treatment of freight and insurance, in first-sale arrangements, or in the tariff line an item is entered under will all move collections without any change in the physical goods. This is not necessarily improper. Classification is genuinely difficult for complex products, and the difference between two adjacent lines can be several percentage points.
The fourth is timing, and in a year of announced tariff changes it is likely to be the largest single factor. When importers expect a rate to rise on a known date, they pull shipments forward. The effect is a surge in dutiable volume ahead of the deadline, followed by a trough afterwards. A fiscal year that captures the surge will show high collections, and the following fiscal year will show lower ones even if the underlying trade is unchanged, because the goods were imported early rather than not at all.
The front-loading question
The front-loading explanation fits the shape of the data better than any of the alternatives, and it is worth being precise about what that means. It is a hypothesis consistent with the published totals, not a finding, because the Treasury publishes a single duty line and the Census Bureau publishes values by commodity with a lag that makes a clean before-and-after test difficult.
The mechanism is well understood in customs administration. An announced future increase creates an incentive to accelerate imports, and importers with warehouse capacity and available credit act on it. The result is an inventory build ahead of the effective date, a peak in dutiable value in the months before it, and a subsequent decline in the volume of goods that need to be imported at the higher rate. Warehouses hold the difference, and the revenue effect is a shift between periods rather than an increase over the cycle.
If that is what happened, the fiscal 2025 total of 194.866 billion dollars contains a timing premium, and the fiscal 2026 total of 173.219 billion contains the corresponding shortfall. The decline of 21.647 billion dollars would then be partly an artefact of when the goods crossed the border rather than evidence that the tariff base shrank in any durable sense.
There is a testable implication. If front-loading drove the pattern, inventories held by importers and wholesalers should have risen noticeably ahead of the effective dates and fallen afterwards, and the import decline should be concentrated in the categories whose rates changed. Neither test can be run from the duty line alone, and the inventory data that would settle it are published quarterly and revised.
The months that went negative
Treasury publishes the customs line monthly, and the monthly path for fiscal 2026 is not a gradual decline. It is a collection that held between 22 and 31 billion dollars a month from October through April, turned negative in May, fell to minus 25.6 billion in June, stayed negative in July, and then recovered to 12.8 billion in August and 5.9 billion in September.
The published monthly net figures, in billions of dollars, are 31.354 in October 2025, 30.756 in November, 27.892 in December, 27.742 in January 2026, 26.594 in February, 22.155 in March, 22.124 in April, minus 0.042 in May, minus 25.556 in June, minus 8.546 in July, 12.836 in August and 5.910 in September. They sum to the fiscal year total of 173.219 billion.
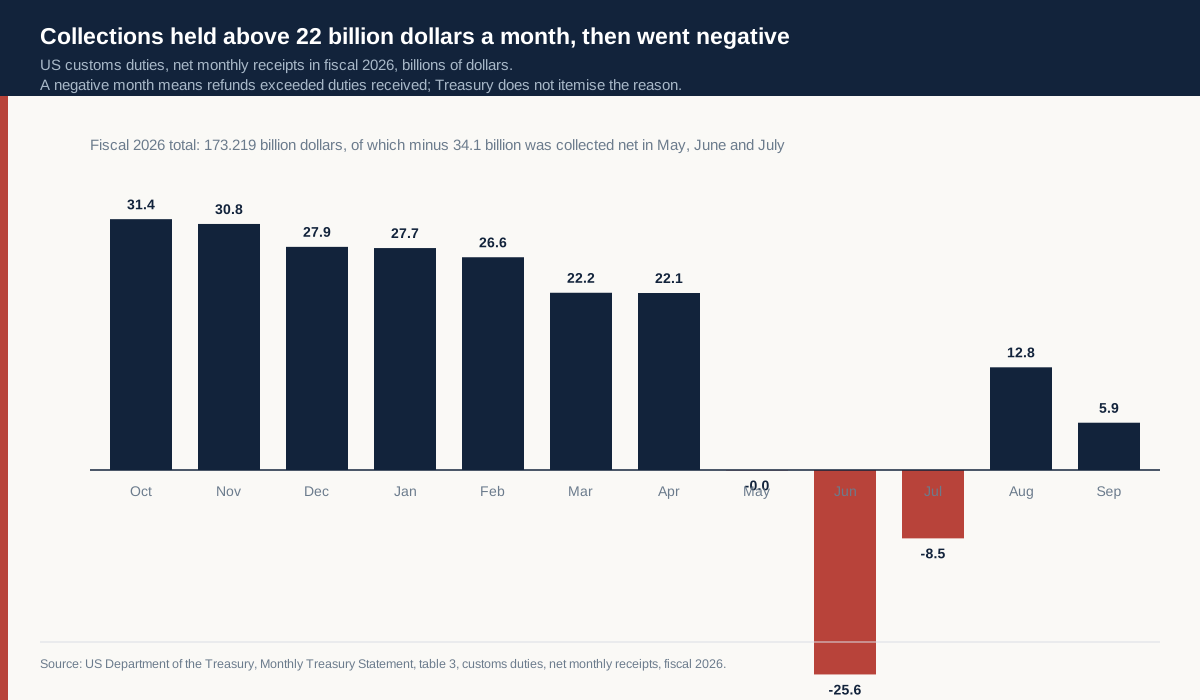
A negative month in a net receipts series means refunds exceeded duties received. The Monthly Treasury Statement reports the net figure and does not itemise the reason, so the public record shows the size and the timing of the reversal without naming its cause. What the shape does establish is that the fiscal year decline was not a slow erosion spread across twelve months. It was concentrated in a single quarter, and the months before it were running at a rate that would have produced a record year if they had continued.
That distinction matters for how the year should be read. A gradual decline would be consistent with the base narrowing as importers reorganised, which is the story a composition argument needs. A three month hole of roughly 34 billion dollars, bracketed by months at 22 billion and a month at 12.8 billion, looks like a discrete reversal of previously collected duty rather than a change in what was crossing the border. The two explanations are not exclusive, and the fiscal year total cannot separate them.
The monthly path also makes the front-loading hypothesis less necessary than it first appears. Collections were strong from October to April for whatever combination of rate, base and timing was in force, and the year was lost in May, June and July. An analysis that explains the whole decline through importers buying ahead of a deadline has to explain why the shortfall landed in a quarter rather than being spread across the year.
The wedge between what is set and what is collected
The more durable finding is not the year-on-year change but the gap between the rate the schedule sets and the rate the customs service collects. The Tax Foundation estimates an applied rate of 11.8 percent for 2026 and an effective rate of 7.2 percent, a difference of 4.6 percentage points. Applied to goods imports of roughly 3.5 trillion dollars, that wedge is worth about 160 billion dollars a year in duty that the schedule implies but the Treasury does not receive.
That number should be handled carefully. The two rates are estimates from a model, not observations, and they measure different things by construction. The applied rate weights the statutory rates by a fixed import basket; the effective rate divides collected revenue by actual imports. The difference therefore contains real economic content, which is that the basket actually imported is not the basket the schedule was written against, and it also contains measurement content, which is that neither estimate is a census of transactions.
Even with that caution, the direction is informative. A wedge of several percentage points between statutory ambition and realised collection is normal in any tariff regime, and its size is a measure of how much of a tariff is a border formality rather than a tax. The categories that typically produce the largest wedge are exemptions for goods that are not produced domestically, exclusions granted after a review, goods entered under preference programmes, and low-value shipments that fall below a de minimis threshold or are cleared through simplified procedures.
Each of those is a policy choice rather than an administrative failure, and each has a constituency. An exclusion for a component that no domestic plant makes protects the manufacturers who use it and forgoes the revenue. A preference programme for a partner country buys diplomatic value and costs collections. The wedge is therefore a map of the political settlements that surround the schedule, and it is more interesting than the headline rate because it shows where the settlements are.
A tax on a moving base
The deeper issue is structural, and it applies to every tariff regime rather than to this one. Duty revenue equals the rate multiplied by the dutiable value, and both terms move in response to the tariff itself. Raise a rate and the dutiable value can fall, because importers substitute, reclassify, relocate the last stage of production, or stop importing the product. The revenue-maximising rate is not the highest rate, and where it sits depends on elasticities that no government knows precisely in advance.
The 2026 numbers are a live demonstration of the second term moving. Import value rose, the schedule stayed restrictive, and collections fell. Whether the cause was composition, exclusions, valuation or timing, the outcome is the same: the base did not behave as the rate assumed.
There is a further complication specific to tariffs as a revenue instrument. Unlike an income tax or a consumption tax, the base is measured at a border and can be changed by moving production rather than by changing behaviour inside the taxing jurisdiction. A manufacturer facing a duty on finished goods can shift assembly to a third country and export from there, and the tariff then applies to a smaller value added in the original location, or to nothing at all. The revenue effect is immediate and the industrial effect is gradual, which means the fiscal cost appears before the policy debate about the industrial outcome has even started.
For a budget, that makes the tariff an unusually unreliable line. It behaves like a windfall in the year of announcement, when front-loading inflates the base, and like a shrinking line afterwards. The 2025 to 2026 sequence in the Treasury statement is exactly that shape.
The receipts arithmetic
Customs duties are a small share of federal receipts and a volatile one. At 3.72 percent in fiscal 2025 they were the largest share in decades, and at 3.20 percent in fiscal 2026 they were still well above the 2 percent range that characterised the 2010s. Total receipts rose 168.7 billion dollars between the two years, from 5,234.6 billion to 5,403.3 billion, while duties fell 21.6 billion. The duty decline offset about 12.8 percent of the growth in everything else.
The scale of the 2025 jump is easier to see against the prior year. The same Treasury series reports 77.037 billion dollars of customs duties in fiscal 2024, so fiscal 2025 collected 2.53 times as much as the year before. That is the number that makes the 2026 decline meaningful: the base being compared against was not a normal year, it was an exceptional one, and a fall back to 173.219 billion still leaves collections at more than twice the 2024 level.
That is the frame in which the tariff should be judged as fiscal policy. It is not a funding mechanism for the federal government at these rates, and it was never going to be. It is a trade instrument that raises meaningful but secondary revenue, and its fiscal contribution is now moving in the opposite direction to the rest of the budget.
The comparison that matters for the next two years is between the applied rate and the collected rate, because the first is a policy variable and the second is what the budget experiences. If the wedge narrows, collections rise without any change in the schedule, which is what closing an exclusion or tightening a valuation rule would produce. If the wedge widens, collections fall while the schedule looks unchanged, which is what a shift in the import mix toward exempt categories produces. The Treasury line will show the result either way, and it will not show the cause.
What would settle the question
Three pieces of evidence would resolve most of the ambiguity, and none of them is currently published in a form that allows a clean test.
The first is a commodity-level breakdown of duty collected against value imported, published quarterly. The Census Bureau publishes import values by commodity and the Treasury publishes total duties, but the two are not joined at the commodity level in any public dataset. That join is what would distinguish a composition effect from a rate effect, and without it every explanation remains a story about aggregates.
The second is an inventory series for imported goods held by wholesalers, timed against the effective dates of rate changes. The front-loading hypothesis predicts a specific pattern in that series, and the pattern is observable in principle. The data exist but are published with a lag and with revisions that blur the timing.
The third is a valuation audit, which customs authorities conduct but rarely publish in a form that can be compared across years. Declared values are the least visible input to the whole calculation and potentially the most consequential, because a small systematic change in declared value moves collections by more than a small change in the rate.
Until those exist, the honest description of 2026 is that duty collections fell by 11.1 percent while the value of imports rose, that the effective rate is about 60 percent of the applied rate, and that the difference between the two is the space in which the policy actually operates.
How a customs value is built
Every duty calculation begins with a value, and the value is not the price on the invoice unless the invoice happens to describe the transaction in the way the customs code requires. The mechanics matter because a small systematic difference in declared value moves collections by more than a small change in the rate, and the mechanics are where most of the unexplained variation between applied and collected rates lives.
The standard basis is the transaction value: the price actually paid or payable for the goods when sold for export, adjusted for certain additions such as commissions, packing costs, and the value of assists that the buyer supplied to the producer. Freight and insurance are added or excluded depending on whether the destination uses a cost-insurance-freight basis or a free-on-board basis, and the difference between those two conventions is not trivial for goods that travel a long way.
Several legitimate arrangements produce a customs value lower than the retail or wholesale price a buyer would recognise. First-sale valuation allows the value to be set at the price of an earlier sale in the chain, provided the conditions are met, which can be materially below the price the importer pays its supplier. Related-party transactions are permitted at a transfer price if the importer can demonstrate that the relationship did not influence the price. Royalties, tooling and design costs are added only when the code says they must be, and the line between a payment for goods and a payment for something else is litigated constantly.
None of this is evasion. It is the ordinary operation of a valuation system that has to accommodate a supply chain in which the entity that designs a product, the entity that makes it and the entity that sells it are frequently three different companies in three different countries. But it does mean that the duty collected on a shipment is a function of how the transaction was structured, and that the structure can change without any change in the physical goods or the statutory rate.
For anyone reading a revenue series, the implication is that collections are partly a measure of documentation practice. A year in which importers reorganise their supply chains to consolidate invoicing, or in which a customs authority tightens its valuation checks on a particular corridor, will show a movement in duties that has nothing to do with trade volumes or with the schedule.
Three channels through which the schedule leaks
The gap between the applied rate and the collected rate is not a single leak. It is at least three, and they behave differently.
Exemptions remove goods from the base. Some are written into the schedule for products that are not made domestically, on the argument that taxing an input raises costs for domestic producers without protecting anything. Others are granted through a process that reviews applications product by product. The first kind is stable and predictable; the second kind is discretionary and creates an incentive to apply, which is why the number of exclusion requests is itself a useful indicator of how binding the tariff is.
Preference programmes reduce the rate for goods from particular places. A trade agreement, a generalised preference scheme or a unilateral concession all move a shipment from the standard rate to a lower one, and the paperwork that establishes origin is the mechanism. Rules of origin are where these programmes are actually enforced, and they are frequently more restrictive than the headline preference suggests, which is why utilisation rates for preference programmes are often well below what the eligible trade would imply.
Classification places goods in a category, and the category carries a rate. The tariff schedule has thousands of lines, some of them distinguished by characteristics that are difficult to establish at a border, and the difference between two adjacent lines can be several percentage points. Classification is a professional discipline with its own jurisprudence, and a change in how a product is commonly classified can move a large volume of trade between rates without any legislative action.
A fourth channel, timing, has already been described and belongs on the list for completeness. Goods imported before a rate takes effect are taxed at the old rate, and the same goods imported after are taxed at the new one. In a year with several announced changes, the calendar becomes a variable in the revenue equation.
A worked example of the wedge
Consider a container of goods with a declared customs value of one million dollars. At the 11.8 percent applied rate the duty is 118,000 dollars. At the 7.2 percent effective rate it is 72,000 dollars. The difference on that single container is 46,000 dollars, which is roughly the value of the goods in a small second container.
Scale the example to the national figures and the arithmetic is the same shape. A 4.6 point wedge on 3.5 trillion dollars of imports is about 160 billion dollars, which is larger than the entire customs revenue line the Treasury reports. That comparison is the clearest way to see why the applied rate is not a budget forecast: the difference between the rate and the collection is not a rounding error, it is the majority of the theoretical tax.
The comparison also shows why a policy that raises the applied rate produces a revenue response that is smaller than proportional. If a third of the base is outside the rate for one reason or another, a ten percent increase in the rate raises collections by less than ten percent, and the shortfall is larger in the categories where exemptions are most common. The 2025 jump from 2.4 to 7.7 percent was large partly because it started from a low base and partly because the schedule was new enough that the leak channels had not yet been used.
Reading the monthly line
The Monthly Treasury Statement is published within days of the month it describes, which makes it the fastest official signal of what trade policy is producing. It is also a monthly series with strong seasonal patterns, and a single month should not be read as a trend.
Customs collections follow the import calendar with a lag of days to weeks. They peak when import volumes peak, which in the United States is typically late summer and autumn as retailers build inventory for the holiday season, and they fall in the early months of the year. A September total of 5.910 billion dollars, as the 2026 statement reports, is therefore not directly comparable to a January total without seasonal adjustment.
The fiscal-year total is the more reliable unit of analysis, and the two most recent ones tell a clear story when read together. Fiscal 2025 captured the introduction of the 2025 schedule and whatever front-loading it induced. Fiscal 2026 captured the year after, when the base had been reorganised and the schedule had been in force long enough for exemptions and classification to settle. The 11.1 percent decline is the difference between those two conditions.
A reader who wants to track the policy's revenue effect from here should watch three things in the monthly statement: the duty line relative to the same month a year earlier, the ratio of duties to total receipts, and the direction of the effective rate as estimated by the independent trackers. The first two are in the document. The third is not, and the gap between what the document shows and what the trackers estimate is itself the most informative number in the series.
What the decline does not say
It does not say that imports fell, because they grew on the trade series. It does not say that the tariff stopped being collected, because the customs service collected 173 billion dollars, which is more than it collected in any year before 2025. And it does not say that the schedule was withdrawn, because the applied rate estimated for 2026 is higher than the effective rate collected in 2025.
What it says is narrower and more difficult to use in an argument. The revenue from a tariff depends on four things at once, which are the rate, the value of what crosses the border, the share of that value that is dutiable, and the moment at which it crossed. Three of those four moved in 2026, and only one of them was set by the schedule.
That is why the 11.1 percent decline should not be read as a verdict on the policy in either direction. A government that wants to demonstrate that its tariffs are working will find better evidence in the applied rate and in the exclusion lists than in the revenue line. A government that wants to demonstrate that they are failing will find better evidence in import volumes and in the trade balance than in the same line. The revenue figure is the least rhetorical of the tariff statistics and the most easily misused, because it is a single number produced by four variables and it does not announce which of them moved.
The politics of a tax that shrinks
A tariff is unusual among taxes in that its advocates can point to a number that went up sharply and its opponents can point to the same number going down a year later, and both can be describing the same policy accurately. The 2025 fiscal year was the best year for customs revenue in decades. The 2026 fiscal year was a decline of 11.1 percent. Neither statement requires a change in the law.
That ambiguity is politically useful and analytically unhelpful. It allows a government to claim the revenue as evidence of resolve and to explain away the decline as the result of successful negotiation, without either claim being testable against the published series. It also allows critics to describe the decline as proof that the policy failed, when the more likely explanation is that the base moved.
The one claim the data do support is about the relationship between the rate and the revenue. A schedule that sets rates well above what the customs service collects is a schedule whose economic effect is being delivered through exemptions, exclusions and reclassification rather than through the payment of duty. Whether that is a success or a failure depends on which of those channels the government intended, and the Treasury statement does not say.
What it does say is precise. In the fiscal year to 30 September 2026, the United States collected 173.219 billion dollars in customs duties, 21.647 billion less than the year before, on a base of goods imports that grew. The difference between those two facts is not a mystery to be resolved by argument from first principles. It is a measurement problem waiting for a dataset that joins the rate to the shipment, and until that dataset exists, the safest reading is the one the arithmetic supports: the tariff is a tax on a base that responds to the tax, and in 2026 the base responded.