
Brent crude settled at $118.35 on 31 March 2026, the highest level of the crisis. On 1 July it closed at $71.57 — below where it traded the day the war began. Between those two dates the Strait of Hormuz, which had carried about a fifth of the world's oil, was closed, fought over, partially cleared of mines, and then shut again; a ceasefire was declared, collapsed, and was replaced by an expired memorandum; and Qatar's LNG output, force-majeured in March, was still largely unable to leave the Gulf.
A market that loses a fifth of its supply and ends the quarter unchanged is not a market that has digested a shock. It is a market in which something else absorbed the shock. This report reconstructs, from the primary data now available, what that something else was, how much of the gap it covered, and which parts of the oil market never returned to their pre-war condition even as the price did.
What the closure removed, in barrels
The baseline first. The US Energy Information Administration's chokepoint analysis — the reference series for Hormuz volumes — put crude, condensate and petroleum-product transits at roughly 20 million barrels per day in the first half of 2025, about a quarter of the world's seaborne oil trade. The destination is as important as the volume: China, India, Japan and South Korea take about three-quarters of the crude moving through the strait, which is why Asia's refineries, not the futures market in London, were the first price-takers in this crisis.
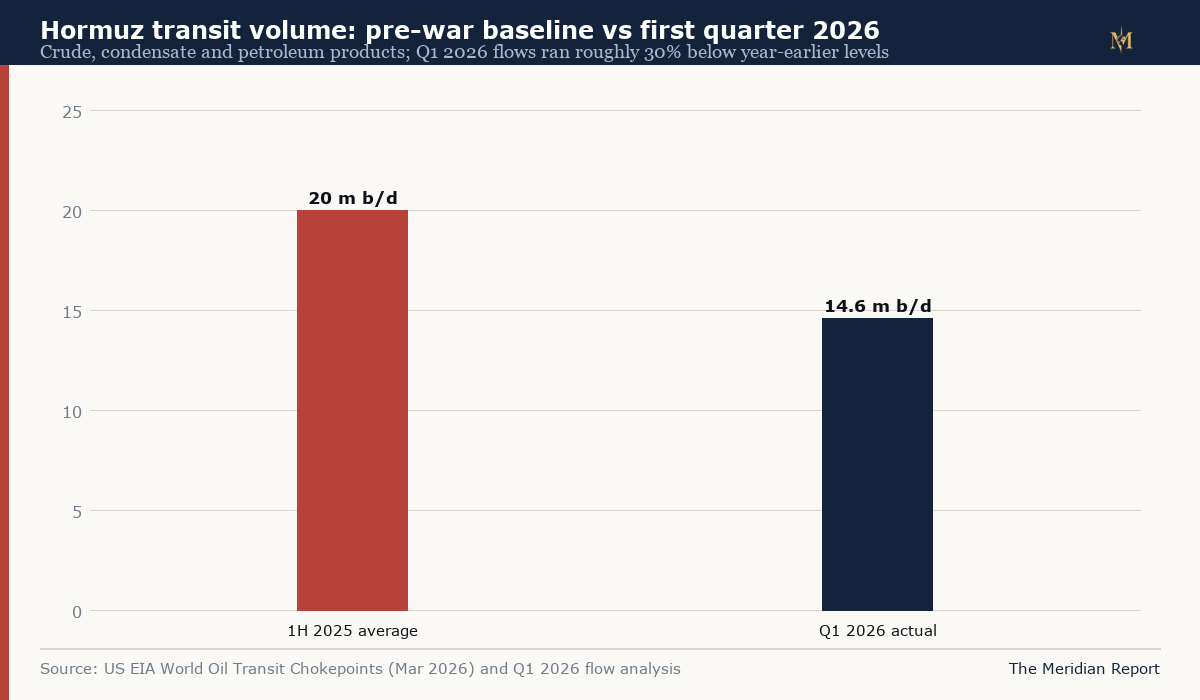
Iran closed the strait to foreign shipping in the days after the US–Israeli strikes of 28 February, with the IRGC announcing "complete control" on 4 March. The EIA's first crisis-quarter accounting, published in May, measured the result: Q1 2026 transits averaged 14.6 million barrels per day — roughly 30 percent below the year-earlier level. That is the measured decline, and it is worth pausing on its size: a 5–6 million barrel per day reduction in the world's most-traded waterway, in a single quarter, is larger than anything in the post-1973 record, the judgment the IEA's executive director formalised on 20 March when he described the war as creating "the largest supply disruption in the history of the global oil market."
Two caveats attach to the Q1 figure before it is used. First, it is an average over a quarter in which the closure tightened week by week; the daily rate by late March was lower than the average, and the flows that continued included Iran-approved cargoes, mostly bound for China and India, some under naval escort. Second, producer-side estimates ran higher than the transit measurements: reported output losses across Kuwait, Iraq, Saudi Arabia and the UAE reached 6.7 million barrels per day by 10 March and were estimated at 10 million or more by 12 March, partly because export infrastructure — loading terminals, escort-dependent routes — could not operate even where production continued. The gap between what fields produced and what tankers could load was one of the crisis's defining frictions.
Kpler's tanker-tracking data, published on 20 August, measures the same system on a narrower basis — oil cargoes exiting the Gulf — on which the 2025 average was about 15 million barrels per day. On that measure the blockade months were starved to 2.3 million barrels per day, or roughly 15 percent of normal.
The emergency bridge: the largest stock release ever attempted
The gap between what the Gulf exported and what the world's refiners needed was bridged, in the first instance, by the member governments of the International Energy Agency.
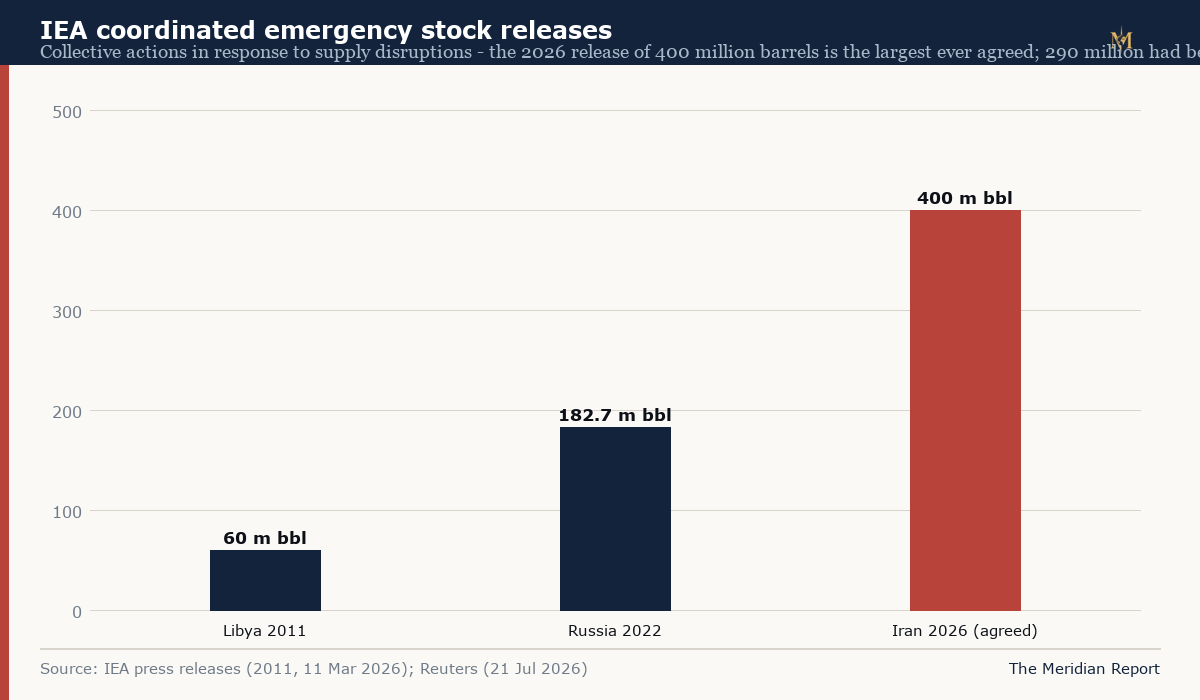
On 11 March 2026 — twelve days into the closure — the IEA's 32 member countries unanimously agreed to release 400 million barrels from emergency reserves, the largest collective action in the agency's fifty-year history, against the 182.7 million barrels of the 2022 release and 60 million in 2011. By 21 July, the IEA reported that members had delivered 290 million barrels of that commitment, with roughly a billion barrels of emergency stocks still in the ground. The scale deserves one sentence of context: at a delivery pace comparable to the earlier releases, 290 million barrels over four and a half months amounts to roughly 2 million barrels per day of additional supply — not enough to replace a 20-million-barrel waterway, but enough to replace a large share of the measured Q1 shortfall while other adjustments took hold.
The other adjustments were already in the market before the crisis began. The IEA's March Oil Market Report assessed global observed crude and product inventories at more than 8.2 billion barrels — the highest level in the series' recent record — which means the shock arrived into a system holding months of demand as stock. OPEC+ producers outside the Gulf held spare capacity through the period. And demand did not collapse: the IMF, revising its World Economic Outlook in July, kept 2026 global growth at 3.0 percent, judging — per its own statement — that the oil shock's drag was being offset by AI-driven investment demand, a conclusion consistent with equity markets recovering through the crisis (the S&P 500, after falling to 6,316.91 on 30 March, closed at 7,411.98 on 24 July).
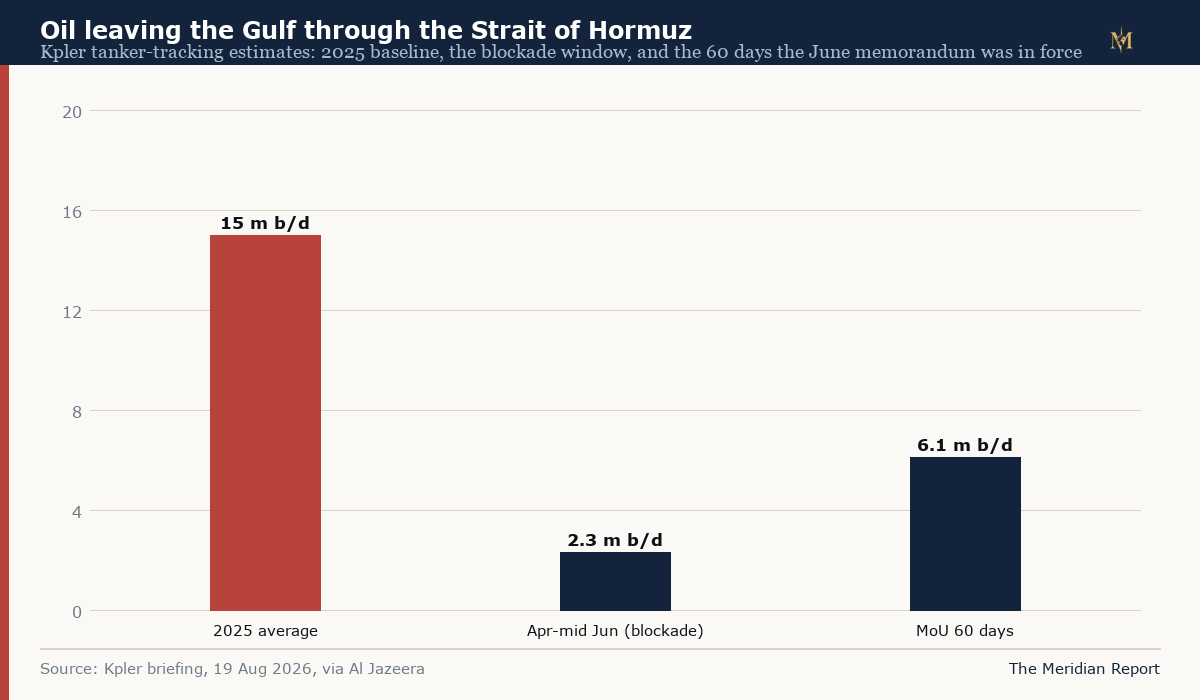
The physical recovery, when it came, was partial and temporary. During the 60 days the US–Iran memorandum of understanding was in force — signed 17 June, expired 17 August — Kpler counted 374 million barrels exiting the Gulf, about 6.1 million barrels per day: nearly triple the blockade rate, but roughly 40 percent of the 2025 baseline on the firm's own comparison. More than half of those cargoes moved in the first three weeks of the agreement; Kpler's market-data head described the flow's final weeks as thinner, darker and re-accumulating behind the chokepoint. After the memorandum expired, Lloyd's List Intelligence's preliminary count recorded 73 transits in the week of 10–16 August against 91 the week before, and the UK Maritime Trade Operations centre logged attacks on five commercial vessels in the same period.
The bypass arithmetic: what the pipelines could and could not do
The Gulf's producers have spent four decades building partial exits from the strait, and the crisis tested them. The US Energy Information Administration's March 2026 chokepoint analysis puts existing usable bypass capacity — Saudi Arabia's East–West pipeline to the Red Sea and the UAE's Habshan–Fujairah line — at about 4.7 million barrels per day. Saudi Aramco said on 10 March that roughly 5 million barrels per day could be made available on the East–West system, whose total nameplate capacity is 7 million: the difference is the line's existing commitment to domestic refining and Red Sea markets. The UAE, which exports roughly 1.5 million barrels per day through Fujairah, is fast-tracking a second pipeline to lift that to about 3.6 million by mid-2027, according to Kpler's infrastructure analysis.
Set against the shortfall, the arithmetic is sobering. The Q1 transit decline on the EIA's basis was roughly 5.4 million barrels per day; the total usable bypass capacity was less than that on its own, and much of it was already in use before the war, serving markets it reaches more cheaply than a Red Sea route would. Bypass pipelines are built for diversification, not substitution: they cover a fraction of a 20-million-barrel waterway, they serve crude but not the LNG trade (no pipeline exits Qatar for the sea lanes), and their expansion timelines — the UAE's measured in years — are set by construction, not by ceasefires. The gap between what the pipelines offered and what the strait carried is the single best reason the emergency stock release had to do the work it did.
Asia, the offtaker of three-quarters of the strait
The crisis's demand side was always going to be Asian. Roughly three-quarters of the crude transiting Hormuz is bound for China, India, Japan and South Korea, with Pakistan and Bangladesh among the most price-sensitive smaller buyers and Singapore and Taiwan disproportionately dependent on Qatari LNG. The stranding of that trade produced the crisis's most distinctive shortages: the Philippines declared a national emergency on 24 March as fuel distribution failed; Vietnam, Zimbabwe, Pakistan, Bangladesh and Nigeria saw comparable disruption; and analysts quoted in the regional press described the panic buying in better-stocked India and Australia as a distribution problem rather than a supply one.
The exception that proved the rule ran through the closure itself: Iran-approved vessels, mostly bound for China and India, continued to transit the strait from the war's earliest days, some under escort. The two largest buyers of seaborne crude kept buying — discounted, escorted, and outside the insurance market that had repriced everyone else. That asymmetry matters for reading the price: the marginal barrel that remained available through the blockade was flowing to exactly the economies that set seaborne crude's marginal price, which is one reason the price signal stayed orderly even as Western-origin traffic collapsed. It is also, so far as the public record shows, the quiet beginning of a structural question Asian refiners will carry beyond the war — what premium their route security now commands.
The precedent: the 1980s Tanker War, at a faster tempo
The Gulf has fought a shipping war before. Between 1984 and 1988, in the Iran–Iraq War's so-called Tanker War, Iraq attacked merchant shipping 283 times and Iran 168 times — 451 attacks killing 116 merchant sailors, by the US Naval History and Heritage Command's tally. The strait was never fully closed: oil kept moving at higher cost, the United States reflagged and escorted Kuwaiti tankers from 1987, and the market absorbed the losses as a running toll.
The 2026 tempo exceeds it. The International Maritime Organization counted 46 attacks on commercial shipping in the first hundred days of this war — an annualised rate well above the Tanker War's four-year average — with attacks continuing across the April ceasefire. What has not yet repeated is the precedent's outcome: escorts and reflagging kept 1980s tonnage moving, and the 2026 equivalent — the US escort announcements of March, the mine-clearance campaign — has so far produced only partial recovery. Whether that is tempo, tactics, or the sheer density of traffic now trapped behind the chokepoint is a question the available data does not answer.
The mines and the queue
Two physical facts about the strait itself defined the summer's ceiling. The first is mines: by 25 August, US officials confirmed that the Navy had cleared the strait's traffic separation scheme, with underwater drones having identified more than 100 suspected mines that private contractors then removed or detonated. The figure is itself a measurement of method — a scanning-and-clearance campaign run largely by contractors rather than a fleet operation — and it is the mechanism behind the Trump administration's repeated claims that the strait is "open", claims the transit counts complicate.
The second is the queue. At its June reporting date the IMO estimated roughly 1,000 ships and 20,000 crew held in the Arabian Gulf, a stranding then more than 100 days old — container ships, bulkers and gas carriers with no cargo to load and no safe exit, alongside the tankers. The crew dimension is the crisis's least-priced cost: 18 seafarers confirmed killed by 20 August, wages renegotiated at war rates, and repatriation logistics that shipping associations described in terms normally reserved for natural disasters. No futures curve prices this. It enters the economy later, as crew costs, insurance loadings and the slow re-routing decisions of owners who decide the Gulf is no longer worth the delay.
The price arc, week by week
The futures market's path through the crisis can be traced on a handful of well-documented observations:
| Date | Brent, $/barrel | What was happening |
|---|---|---|
| Mid-February 2026 | low $70s | Pre-war trading range; the year had opened near $61 |
| 2 March | ~$80–82 | Strikes began 28 Feb; closure announced; +10–13% |
| Late March | rising past $110 | Closure tightens; Qatar force majeure (4 Mar); producer losses mount |
| 31 March | 118.35 (crisis peak) | Blockade at full effect; UN Security Council split |
| 8 April | falling | Ceasefire declared after 39 days of hostilities |
| 11 March – July | declining | IEA release underway (400m agreed; 290m delivered by 21 Jul) |
| 17 June | falling | US–Iran memorandum signed at Versailles |
| 26 June – 1 July | 71.57 | NYT: "return to prewar levels, four months later"; Brent below $71 on 2 Jul |
| Mid-July | rising again | Attacks resume; truce collapses 8 Jul; blockade reinstated 14 Jul |
| Week of 20 July | above $100 | Re-escalation; strikes resume |
| 26–28 July | 88.36 | US pauses strikes; Brent falls 8.7% in a day, lowest since 17 Jul |
| 18 September | ~103 | MoU expired 17 Aug; flows partial; EIA expects ~$90 average in 2H26 |
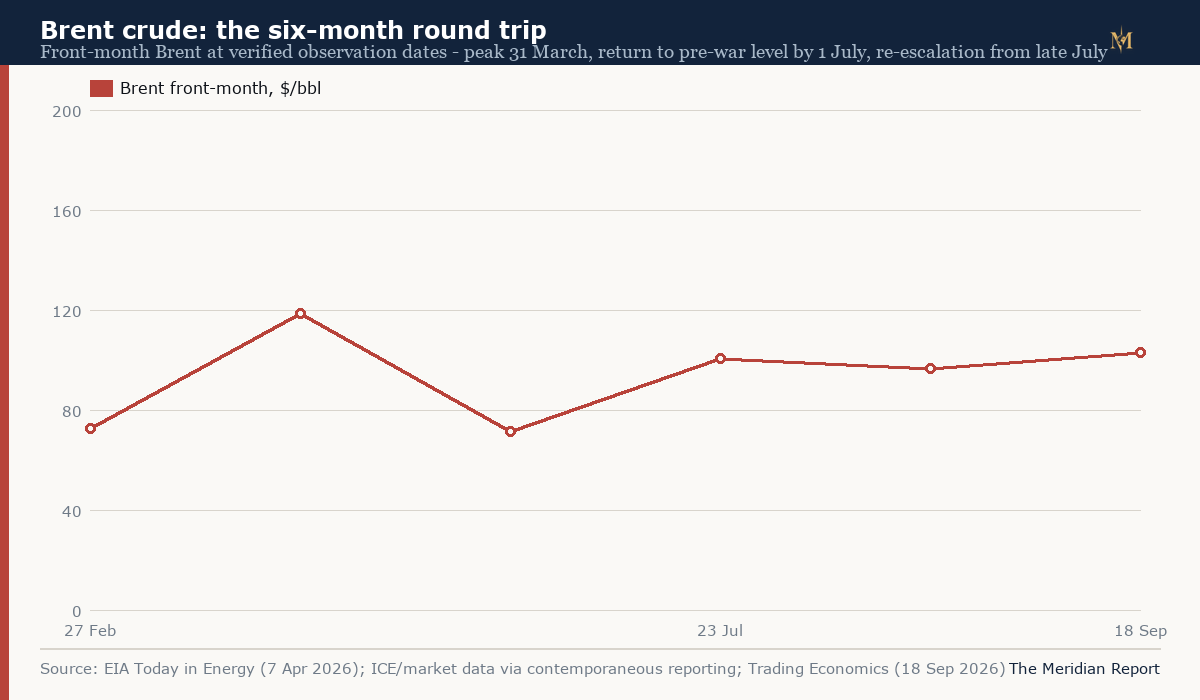
Three features of this arc matter for what follows. The peak-to-trough decline was 40 percent — in a quarter when the strait's flows, on the Kpler measure, went from 15 percent of normal to not much more. The return to the pre-war price occurred before the memorandum was signed, not after — the low came on 1 July, seventeen days before the Versailles signature. And the price has since settled into a band roughly 40 percent above pre-war levels, which is the market's own ongoing estimate of what a partially-blocked strait is worth.
Why the price fell while the strait stayed shut
The chronological facts are easy to state; their weighting is not, and this section is deliberately more cautious than the chronology. What the evidence supports is a set of four contributors whose relative sizes the public data cannot separate.
Strategic stocks did the mechanical work. The 290 million barrels the IEA delivered by late July is, at the delivery rates implied by the agency's own reporting, a multi-million-barrel-per-day supplement sustained across the exact window in which prices fell from $118 to $71. That is an observation about timing and scale, not a measured causal share — no dataset isolates the release's price effect from everything else — but the correlation in the timeline is strong, and it is the largest deliberate supply addition in the market's history arriving during the price's decline.
The market was pricing reopening, not recovery. Futures are claims on future delivery, and from the ceasefire of 8 April onward each diplomatic step — the April ceasefire, the May pause of "Project Freedom," the mine-clearance announcements, the June memorandum — moved the expected future supply curve before any physical barrel moved. Brent's low arriving before the memorandum's signature is consistent with that forward-looking structure: the price anticipated the reopening's anticipation, so to speak, and corrected for real flows only partially and later. The New York Times' late-June framing — prices back to pre-war levels four months after the shock — captured the same asymmetry from the demand side.
Inventories and demand made the shock absorbable. The 8.2-billion-barrel inventory base meant refiners facing lost Gulf barrels could buy from stock rather than bid for cargoes. Held-flat global growth meant the demand destruction that would otherwise have forced prices down was not required. Several analysts quoted through the crisis, and the IMF explicitly, attributed the contained macro damage to these starting conditions rather than to any virtue of the market's price signal.
The precedent channel compressed the risk premium. In the June 2025 Twelve-Day War, a $10–15 per barrel risk premium had dissipated within days of ceasefire, as MCB Group's market analysis noted; the 1990 and 2003 shocks saw prices round-trip within months. Traders who had watched 2025's premium evaporate had documented grounds for treating this crisis's peak as inflated, and the subsequent behaviour of the price — its willingness to fall 8.7 percent on a single pause announcement — is what a market trading a decompressing premium looks like.
The honest summary: the round trip was the joint product of record-scale policy intervention, forward-looking pricing, comfortable starting inventories, and a demand base that did not crack. The evidence does not support assigning the shares among them, and claims that any single one "caused" the round trip go beyond what the data can show.
What never round-tripped
The futures contract returned to pre-war levels. The cost of actually moving oil through the Gulf did not, and by the end of the summer the gap between the two was the clearest single measurement the crisis produced.
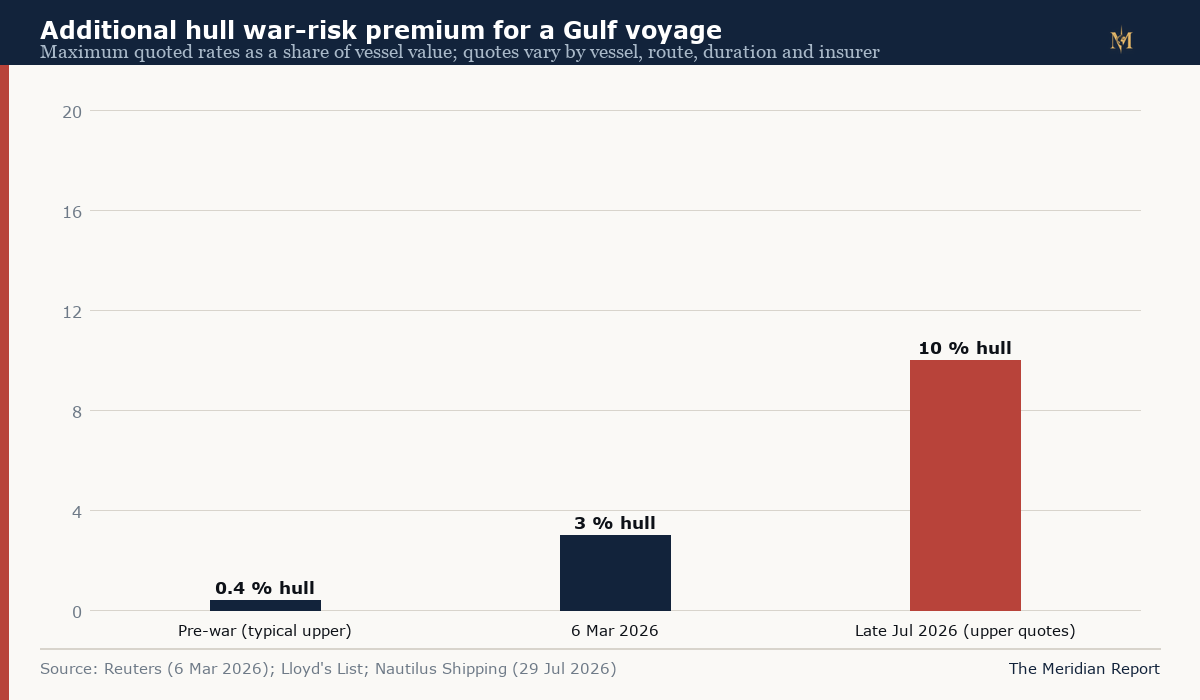
Insurance. Additional hull war-risk premium for a Gulf voyage — roughly 0.125–0.4 percent of vessel value per voyage in peacetime — reached about 3 percent by 6 March, according to Reuters' reporting from London brokers: on a typical $250 million tanker, about $7.5 million per transit. By late July, Lloyd's List reported quotes for high-risk vessels at 10 percent of hull value, in the double-digit millions of dollars per trip, and trade sources described premiums of 7.5–10 percent across the tanker segment. For a VLCC carrying two million barrels, a 10 percent premium works out to roughly $0.50–0.55 per barrel of cargo on its own — before freight, before the escort delays, before the risk of the voyage not completing. The premium has come off its extremes at various points, but no source describes it as having returned to pre-war levels; the market's insurers, unlike its futures traders, never priced the war away.
Freight and transit counts. The oil shipping index that peaked at 3,737 in March stood at 1,850 in July — down by half, but far above pre-crisis levels. Transit counts after the memorandum's expiry (73 in the week of 10–16 August, against 91 the prior week and several hundred in a normal week on the pre-war baseline) put physical traffic back at a fraction of normal. Kpler's post-MoU reading — 6.1 million barrels per day exiting the Gulf against a 15 million baseline — is the same measurement in volume terms: at summer's end, roughly 60 percent of the system's normal throughput was still missing.
The human ledger. The International Maritime Organization counted 46 attacks on commercial shipping as of 11 June, with 14 seafarers killed; by 20 August the count of dead had reached at least 18, including a crew member of the bulker Minoan Dignity killed on 18 August — the first confirmed death since July. The IMO also reported, at the June date, roughly 1,000 ships and 20,000 crew held in the Arabian Gulf by the crisis, a stranding then more than 100 days old. US forces have acknowledged about half a dozen of the attacks, including a 10 June strike on a Palau-flagged tanker that killed three Indian seafarers; no government has claimed the August attack. These counts, unlike futures prices, have no round trip in them.
The gas market that did not come back. QatarEnergy declared force majeure on LNG exports on 4 March; an 18 March strike on the inactive Ras Laffan industrial complex cut Qatar's liquefaction capacity by a reported 17 percent, with damage estimated at three to five years to repair. European gas prices nearly doubled to above €60/MWh in March — the mechanism by which a Middle East war reached European industry, whose chemical and steel producers imposed surcharges of up to 30 percent. Asia LNG spot rose by more than 140 percent. The MoU's expiry leaves the LNG strand of the crisis substantially unresolved: liquefaction capacity, unlike a strait, cannot be reopened by escort.
How the shock ranks against the oil crises on record
The comparisons that matter are with the four shocks the market actually remembers. In 1973–74, the Arab oil embargo's peak loss was about 4.5 million barrels per day, and the price quadrupled in months. In 1979, the Iranian revolution removed Iranian output — 4.8 million barrels per day by January, roughly 7 percent of then-world production, by the US Federal Reserve's historical account — with peak disruptions estimated at 5.6 million; because the loss persisted through the revolution's chaos, 1979 still holds the record for cumulative barrels lost, as the Arab Weekly's July comparison noted. In 1990, Iraq's invasion erased Kuwaiti and Iraqi exports for months. In 2022, Russia's oil was never physically removed — only re-routed.
On daily loss, 2026 exceeds all of them: the four Gulf producers' reported losses reached 6.7 million barrels per day within ten days of closure and estimates of 10 million or more by 12 March, and a comparison study published in September put the war's outright daily loss above both the 1973–74 and 1979 peaks. On cumulative loss, the war has not yet caught 1979 — a function of duration, not intensity, and one reason the historical framing matters: a six-week shock at 2026's tempo is survivable; a two-year one is a different object, which is precisely what the market's remaining $20–30 premium is pricing as an open question.
How unusual was the round trip?
Against the market's own history, the 2026 episode's price behaviour was conventional and its policy response was not.
The price comparison first. Brent's peak — about $118, 63 percent above the pre-war level — sits well below the multi-fold price increases of the 1973–74 and 1979 embargoes, and its four-month return to the pre-war level matches the pattern the Congressional Research Service documented for the 1990–91 Gulf War and the 2003 Iraq War: sharp initial spikes, then reversion within months once sustained supply was established. The 2022 episode — a spike toward $130 after Russia's invasion, then a multi-month decline — is the immediate precedent. In each earlier case, however, the underlying physical supply recovered on its own timetable. In 2026 the physical disruption persisted through and beyond the price round trip, held down deliberately in part by one side of the war and only partially reopened by the other.
The policy comparison is where 2026 stands alone. The 400-million-barrel IEA release is the largest collective action in the agency's history — more than twice the 2022 release, six times 2011 — and it was agreed within twelve days of the closure, an improvisation speed the agency's earlier crises did not require. Whether the precedent is stabilising or dangerous is a question analysts have already begun to dispute: a market that has learned producers of last resort can bridge even a Hormuz-scale closure may price future closures differently, and several commentators noted through the summer that the same expectation may have contributed to the speed of the price's decline. That interpretation is plausible and unproven; it is noted here because it will be tested by the next closure, not resolved by this one.
The American pump and the political timer
The futures round trip stopped at the refinery gate. US gasoline averaged above $4 per gallon on 31 March for the first time since 2022 — up more than 30 percent since the strikes began, after a week in early March in which pump prices jumped 48 cents, per AAA's daily tracking through CBS. The pre-war national average had been $2.89–$3.22 in early March. And the round trip never reached the pump: NBC's running national price page still showed an average above $4 per gallon in mid-September, six months in.
The gap between the futures curve and the filling station is structural — retail prices lag crude, and refining margins widened when Gulf-origin product flows tightened — but its political arithmetic is simple. The war entered its sixth month with US midterm campaigns underway and pump prices still roughly a third above their pre-war level, which makes the administration's "the strait is open" claims a matter of domestic politics as much as maritime fact. It also gives both negotiators a standing incentive to produce a durable agreement before winter heating demand tests the gas market the same way the spring tested oil.
The gas crisis running on its own clock
Oil had substitutes and stocks. Qatari LNG had neither. The emirate's liquefaction complex at Ras Laffan — the world's largest — shipped its cargoes exclusively through the strait, and on 4 March QatarEnergy declared force majeure on all of them. European gas benchmarks nearly doubled to above €60/MWh within two weeks, arriving into storage that stood near 30 percent after a cold winter; Asian spot LNG rose more than 140 percent after the 18 March strike on Ras Laffan's industrial city, which cut Qatar's liquefaction capacity by a reported 17 percent, with damage the company indicated would take years to repair.
The consequences ran through two economies at once. Europe's — where the ECB postponed planned rate cuts on 19 March, raised its inflation forecast, and warned of stagflation risks for energy-intensive members, and where chemical and steel producers imposed surcharges of up to 30 percent — and Asia's, where Pakistan and Bangladesh faced price shocks they could barely absorb and where buyers who had built terminals specifically around Qatari cargoes had no workaround at all. A pipeline cannot substitute for an LNG train: unlike crude, which found partial exits, Qatar's gas simply stopped. This is the strand of the crisis with no round trip and no bypass — its recovery runs on repair schedules, not diplomacy, and it will outlast whatever the strait does next.
The sanctions layer bending in real time
Sanctions policy, normally the slowest instrument in the US toolkit, moved at market speed. On 21 June 2026, amid the memorandum's diplomacy, OFAC issued General License X authorising transactions involving Iranian-origin crude oil and petrochemicals, per the Congressional Research Service's August chronology — a formal carve-out in the very restrictions built over a decade to exclude those cargoes, granted while the war continued. The permission was framed as part of the June understanding; its survival beyond the memorandum's expiry remained unclear at this report's cutoff, with the administration simultaneously threatening what it called economic warfare against countries continuing to facilitate Iranian exports.
The episode documents something larger than one licence. The 2026 crisis forced the sanctions architecture — designed to make Iranian oil untouchable — to coexist with an active market in Iranian oil: Iran-approved cargoes moving under escort from the war's first weeks, Chinese and Indian buyers still lifting, a general licence authorising what the blocked strait had already normalised. Whether that coexistence reverts after the war, or hardens into a permanent dual system — sanctioned in law, flowing in fact — is among the war's most consequential open questions for energy markets.
What would change this reading
The report's interpretation rests on measurements that will keep moving, and four of them could alter it materially. A durable reopening — transit counts sustained in the hundreds per week, war-risk quotes back toward 1 percent — would confirm that the round trip was a leading indicator of recovery rather than a policy artefact, and the EIA's outlook path (about $90 averaging through late 2026, declining toward $74 in 2027) describes exactly that expectation. A renewed full closure would test the bridging mechanism at depth: the IEA's remaining billion barrels of emergency stocks against a closure measured in quarters rather than weeks, with the 2022 experience of re-routing no longer available as an offset. The bypass pipelines' mid-2027 timelines — the UAE's expansion to 3.6 million barrels per day chief among them — will change the strait's structural leverage permanently if completed on schedule. And Ras Laffan's repair clock will keep the gas crisis alive regardless of every other series in this report. Each of these is observable in public data, which is the appropriate end for a measurement-driven report: the findings are falsifiable, and the falsification schedule is itself published.
The macro bill, as currently measurable
The crisis's macroeconomic costs are accumulating in data that will be revised, and only their broad shape is worth stating now. The IMF's July revision kept 2026 global growth at 3.0 percent — the shock absorbed, per the Fund's own statement, by the AI investment cycle and the offsetting adjustments documented above. The regional costs are larger: a UNDP study of 30 March estimated $120–194 billion of lost growth across Arab states; European energy-intensive industry took surcharges and recession warnings; and the Gulf's own economic model — import-dependent food systems carrying 80 percent of caloric intake through the strait, desalination-dependent water systems, aviation hubs — absorbed the direct hit, including a 40–120 percent consumer price spike in Gulf retail during the closure weeks. Interest-rate paths bent: the ECB postponed planned reductions on 19 March and raised its inflation forecast, and the Federal Reserve's timetable came under equivalent pressure from US gasoline prices that rose several cents a gallon daily through March.
Against that bill, the market's own verdict — Brent near $103 on 18 September, the EIA's September outlook averaging ~$90 for 2H26 before an expected decline to $74 in 2027 — implies the market believes the remaining crisis is worth a partial premium, not a structural re-pricing. The EIA's 2H26 average of $90 against the pre-war low-$70s is, in effect, the futures market's standing estimate of a partially-blocked Hormuz.
What the public data cannot establish
Three quantities that would sharpen this report's conclusions are not publicly observable, and their absence shapes what follows. First, the physical ownership of the floating oil: how much crude sits in blockade-delayed tankers, owned by whom, financed by whom — the inventory overhang that would tell us whether the MoU-window surge borrowed from future flows. Second, actual delivered costs to the Asian refiners who take three-quarters of Hormuz crude; published benchmarks are London and New York contracts, and the discount structures the crisis forced on Chinese and Indian buyers are contract terms, not market data. Third, the unreported flows: Iran-approved cargoes, shadow-fleet movements and ship-to-ship transfers that tanker trackers acknowledge under-counting, which means the measured 2.3 and 6.1 million barrel figures are floors, not totals. Each gap biases the flow picture toward understatement, which in turn means the price round trip is, if anything, somewhat less anomalous against true physical volumes than it appears against measured ones — though not by an amount anyone can currently quantify.
Conclusion
The 2026 Hormuz crisis produced the largest measured supply disruption in the oil market's history and the largest emergency response to match — 400 million barrels of coordinated release agreed within twelve days, 290 million delivered by mid-summer, into inventories that entered the crisis at multi-year highs. The price response was severe and brief: $118 within a month, the pre-war level regained within four, a partial premium — roughly $20 to $30 per barrel — established since. The physical system has not followed the price: insurance premia remain at multiples of peacetime rates, transit counts remain a fraction of baseline, and Qatar's LNG capacity, damaged in March, remains on a years-long repair clock regardless of what the strait does next.
What the episode demonstrates, on the evidence assembled here, is that the price of crude in 2026 measured the market's confidence in bridging mechanisms — stocks, substitutes, diplomacy — at least as much as it measured the flow of oil through the strait. That distinction has a practical edge for anyone consuming the price signal: a Brent quote in this crisis was a statement about expected policy and diplomacy, and only indirectly about barrels. The barrels themselves — the transit counts, the insurance quotes, the loaded tankers outside the chokepoint — told a slower, less optimistic story, and they are the series to read if the question is what the physical market is actually doing.
The Meridian Report publishes original research and analysis. Corrections: [email protected].
Appendix A. Data tables
Table A1. Brent price observations used in this report
| Date | Price ($/bbl) | Basis | Source |
|---|---|---|---|
| Start of 2026 | ~61 | Front-month Brent, year open | EIA Today in Energy, 7 Apr 2026 |
| Mid-Feb 2026 | low $70s | Pre-war trading range | Al Jazeera, 2 Jul 2026 ("pre-war prices") |
| 2 Mar 2026 | ~80–82 | Post-strike surge, +10–13% | Contemporaneous reporting (compiled) |
| 31 Mar 2026 | 118.35 | Crisis peak (close) | Market data as compiled in contemporaneous reporting; EIA confirms Q1 close at $118 |
| 1–2 Jul 2026 | 71.57 / below 71 | Return to pre-war level | Compiled market data; Al Jazeera, 2 Jul 2026 |
| Week of 20 Jul 2026 | above 100 | Re-escalation | Reuters, 26–28 Jul 2026 ("the previous week surpassed $100") |
| 28 Jul 2026 | 88.36 | After US pause announcement; −8.7% | Reuters |
| 18 Sep 2026 | ~103.2 | Current level | Trading Economics |
Table A2. Physical flow estimates (each series on its own basis)
| Measure | Value | Basis | Source |
|---|---|---|---|
| Hormuz transit, 1H 2025 average | ~20 m b/d | Crude + condensate + products | EIA chokepoints, Mar 2026 |
| Hormuz transit, Q1 2026 | 14.6 m b/d (−~30% y/y) | Same basis | EIA Q1 analysis via Anadolu, 13 May 2026 |
| Gulf oil exits, 2025 average | ~15 m b/d | Kpler cargo-tracking basis | Kpler via Al Jazeera, 20 Aug 2026 |
| Gulf oil exits, Apr–mid-Jun (blockade) | 2.3 m b/d | Same basis | Kpler via Al Jazeera |
| Gulf oil exits, MoU 60 days (17 Jun–17 Aug) | 6.1 m b/d (374m bbl total) | Same basis | Kpler via Al Jazeera |
| Transits, week of 10–16 Aug | 73 (vs 91 prior week) | Preliminary Lloyd's List count | via Al Jazeera |
| Producer output losses, 10/12 Mar | 6.7 / ≥10 m b/d | Reported estimates, four producers | Contemporaneous reporting (compiled) |
Table A3. Policy and security measures
| Measure | Value | Date | Source |
|---|---|---|---|
| IEA collective release, agreed | 400 m bbl (largest ever) | 11 Mar 2026 | IEA press release |
| IEA release, delivered | 290 m bbl | by 21 Jul 2026 | Reuters / IEA |
| Emergency stocks remaining | ~1 bn bbl | Jul 2026 | IEA via Energy Connects |
| Prior record release | 182.7 m bbl (2022) | — | Reuters |
| Global observed inventories | >8.2 bn bbl, multi-year high | Mar 2026 | IEA OMR Mar 2026 |
| UNSC resolution on the strait | Vetoed (Russia, China) | 7 Apr 2026 | Press reporting (compiled) |
Table A4. Transport cost and security indicators
| Measure | Pre-war | Crisis level | Source |
|---|---|---|---|
| Hull war-risk premium, Gulf voyage | 0.125–0.4% of vessel value | ~3% (6 Mar); up to 10% for high-risk vessels (late Jul) | Reuters 6 Mar; Lloyd's List; Nautilus 29 Jul |
| Premium on a $250m tanker | ~$0.3–1.0m/voyage | ~$7.5m (Mar); up to $25m (high-risk quotes) | Derived from the above at stated rates |
| Oil shipping index | baseline | Peak 3,737 (Mar); 1,850 (Jul) | Compiled market data |
| Attacks on commercial shipping | — | 46 by 11 Jun (IMO); 5 vessels in one week post-MoU (UKMTO) | IMO / UKMTO via Al Jazeera |
| Seafarers killed | — | 14 by 11 Jun; ≥18 by 20 Aug | IMO via Al Jazeera |
| Ships / crew stranded in the Gulf | — | ~1,000 ships / 20,000 crew (11 Jun, >100 days) | IMO |
Appendix B. Method notes
Price series. The report uses only Brent observations that each carry a named source (Table A1). Where two sources report the same date, the compiled figure and the agency figure agree ($118 vs $118.35 for the quarter-end; "below $71" vs $71.57 for 1–2 July). Intermediate dates are omitted rather than interpolated; the arc between them is described qualitatively.
Flow series. EIA transit volumes (crude + condensate + products through the strait) and Kpler Gulf-exit cargo volumes are different populations and are never added, averaged or directly ratioed against each other in this report; each chart and table states its basis. The "roughly 40 percent of normal" and "roughly 60 percent missing" figures are Kpler-basis comparisons, as published by the source itself.
Release-rate derivation. The ~2 million barrels per day figure for IEA delivery is derived from 290 million barrels over roughly 130 days (11 March–21 July); it is an average, not a constant observed rate, and the IEA does not publish a daily series. It is used only for order-of-magnitude comparison with the measured flow shortfall.
Insurance arithmetic. The per-barrel premium estimate applies a 7.5–10 percent hull premium to a VLCC cargo value derived from reported vessel values and typical cargo sizes; it is a derived illustration of scale, not a quoted market rate, and individual voyages vary widely.
Attribution. Characterisations of causality in this report are stated at the strength the evidence supports: timing and scale correlations for the stock release, forward-looking pricing mechanics for the futures response, and attributed analyst views where the literature offers competing weights. No single-cause claim is made for the price round trip.