
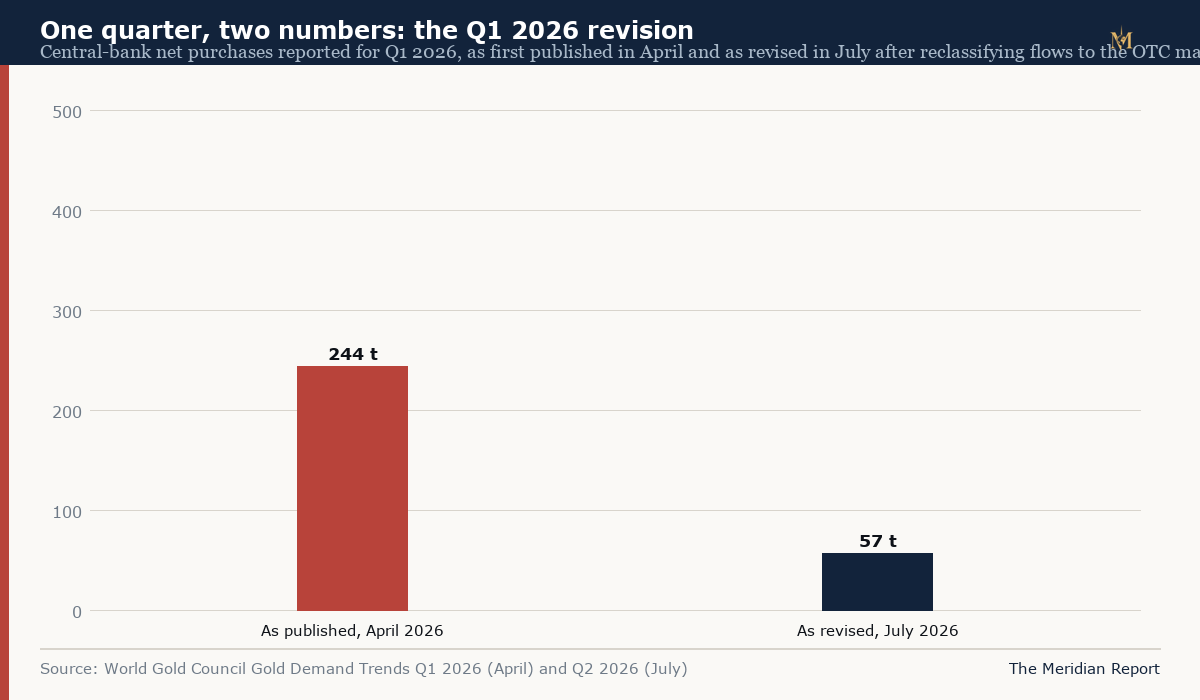
In April 2026, the World Gold Council published a striking number: the world's central banks had bought 244 tonnes of gold in the first quarter, up 17% on the previous quarter, led by Poland and Uzbekistan. The figure circulated through market commentary for three months as further proof that official institutions were accumulating gold at an undiminished pace.
In July, the same organisation published a different number for the same quarter: 57 tonnes.
The revision — a 77% reduction, disclosed in the second-quarter Gold Demand Trends after some central-bank flows were reclassified to the over-the-counter market — was noted by specialist outlets and ignored almost everywhere the original figure had travelled. It is the right place to begin this report, because it demonstrates in a single episode the central problem of this entire subject: the most consequential buyer in the gold market is also the least well measured. The official sector now absorbs hundreds of tonnes of metal a year at prices that set records, on the strength of a dataset that was materially rewritten in public this year — and the rewriting barely registered.
That measurement problem is not incidental to the subject; it is inseparable from it. What follows is an attempt to establish, from primary sources, what the central-bank gold-buying era actually consists of: how much has been bought, who has bought it, what it has cost, what it means for the reserves that back the world's currencies, and — just as important — which of the popular conclusions drawn from these numbers the numbers themselves can carry.
The era in one picture
Begin with the aggregate. Between 1989 and 2009, the official sector was a net seller of gold in almost every year — a twenty-one-year liquidation documented in a 2011 prospectus filing that cites the World Gold Council's own data, and culminating in agreed sale ceilings of 400-500 tonnes a year under the Central Bank Gold Agreements that ran from the Washington Agreement of September 1999 through 2014. European central banks sold systematically through the 2000s; the Swiss National Bank alone sold roughly 1,300 tonnes between 2000 and 2005, and the UK Treasury announced the sale of its 400-tonne-plus programme in 1999, near the bottom of the market.
In 2010, the sign flipped. Central banks have been net buyers every year since — sixteen consecutive years as of 2026, per the World Economic Forum's summary of the record and the World Gold Council's annual data. The annual series, assembled from the World Gold Council's Gold Demand Trends editions, reads:
| Year | Official net purchases (tonnes) |
|---|---|
| 2010 | 79 |
| 2011 | 481 |
| 2012 | 569 |
| 2013 | 629 |
| 2014 | 601 |
| 2015 | 580 |
| 2016 | 395 |
| 2017 | 379 |
| 2018 | 656 |
| 2019 | 605 |
| 2020 | 255 |
| 2021 | 450 |
| 2022 | 1,082 |
| 2023 | 1,037 |
| 2024 | 1,092.4 |
| 2025 | 863.3 |
Two independent cross-checks validate the series' internal consistency. The World Gold Council's 2026 survey states that central banks accumulated an average of about 1,000 tonnes over the past four years — the 2022-2025 entries sum to 4,074.7 tonnes, an average of 1,019. And the same survey cites a 473-tonne average for the preceding decade, which the 2010-2021 entries reproduce exactly (5,679 tonnes over twelve years).
The era has a longer prehistory worth knowing. Official institutions were net purchasers of roughly 4,700 tonnes of gold across 1950-1981 — about 151 million ounces, per the report of the US Gold Commission to Congress — during the decades in which gold's monetary role was being formally redefined after Bretton Woods. The modern record therefore describes three regimes in sequence: a three-decade buyer era, a twenty-one-year liquidation, and the current sixteen-year accumulation that at 9,754 tonnes has already out-bought the 1950-1981 total by more than two to one. The regimes are not symmetrical: the post-war buying was concentrated among a handful of advanced economies adjusting official positions, while the current era's buying is broadly distributed across emerging-market and middle-power institutions. Whether that difference matters to the era's durability is an open question the data cannot yet answer; what is established is that sustained official buying on this scale has happened before, and stopped.
Cumulatively, the 2010-2025 purchases sum to 9,754 tonnes — this report's reconstruction from the annual series above. At the 2025 average price of $3,473 an ounce (LBMA data), that tonnage is mechanically worth about $1.09 trillion. Valued at the September 2026 spot price of roughly $4,400, the same metal is worth about $1.38 trillion. At the average price prevailing across the sixteen buying years themselves — about $1,664 an ounce — the accumulated stock cost on the order of $520 billion. All three figures describe the same tonnes; the difference between them is a lesson in how much the price moved while the buying continued.
Stock arithmetic puts the era in institutional perspective. The official sector's total gold holdings are estimated by the World Gold Council at roughly 36,700 tonnes (a figure published with the FY2023 data; current holdings are somewhat higher). The era's 9,754 tonnes therefore amount to the equivalent of over a quarter of the official sector's entire estimated stockpile — metal that did not sit in official vaults when the era began. At the September 2026 price, the official sector's total gold stock is mechanically worth in the region of $5.2 trillion, against the $13.10 trillion of foreign-exchange reserves the IMF's COFER records for the first quarter of 2026 — a ratio that reproduces, at full scale, the same re-weighting the flow data describe.
The same arithmetic shows how marginal the shift remains. One percent of total official reserves (foreign exchange plus gold, roughly $18 trillion combined) is about $180 billion — which at $4,400 an ounce converts to roughly 1,290 tonnes, more than the official sector bought in any year of the past twelve months and roughly two years of buying at the era's average pace. A reserve manager reallocating a single percentage point of the world's reserves into gold would consume mine output at a rate the market has not had to accommodate in this era. The current shift, in other words, is simultaneously enormous in flow terms and small in stock terms — which is precisely why both the alarmist and dismissive readings of it can coexist, each quoting half the arithmetic.
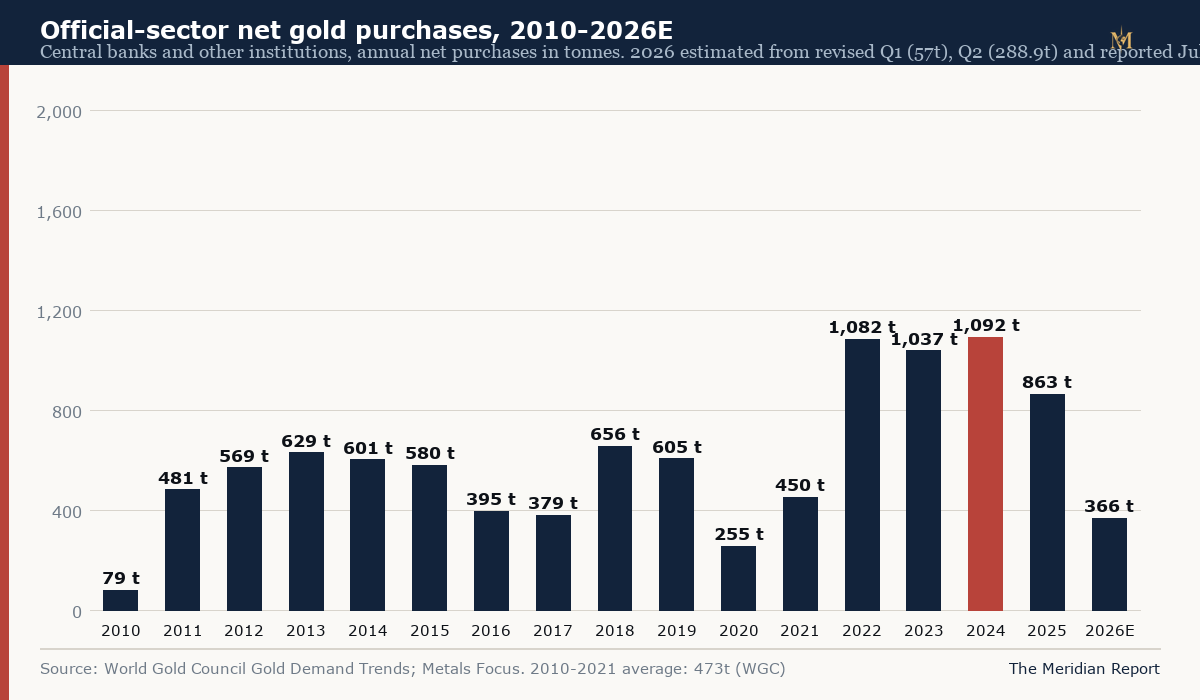
The escalation is recent. From 2010 to 2021 the official sector bought an average of 473 tonnes a year. From 2022 through 2024 it bought more than a thousand tonnes in every year — the three largest annual totals in the recorded series, in sequence. Even 2025, described by the World Gold Council as a year of "somewhat modest" buying, delivered 863 tonnes against that decade-long average — and 2025's total arrived despite record prices that, in the World Gold Council's words, "appeared to prompt a more cautious approach" among banks wary of valuations.
The pace in 2026 is best described as uneven and subject to revision: 57 tonnes in the first quarter as revised, 288.9 in the second — a 62% year-on-year jump and, according to market coverage of the World Gold Council's release, the strongest second quarter in the series' recorded history — and roughly 20 tonnes of reported PBoC buying in July. The first half totalled 345.9 tonnes, about 17% below the first half of 2025. Annualised on that half-year alone, the run-rate would be roughly 690 tonnes; whether the second half repeats the second quarter's strength is not yet knowable from published data.
What the official number can and cannot measure
Every figure in that series is an estimate, and the estimation machinery deserves as much attention as the output. The World Gold Council's central-bank series, compiled by Metals Focus, is built on four distinct bases, of unequal reliability.
The first base is reported holdings: changes in central-bank gold positions as published to the IMF's International Financial Statistics and in the banks' own disclosures. This is the strongest evidence in the system — actual reported positions, from actual institutions, on a monthly or quarterly cadence. It covers the United States, the eurozone, and most advanced economies with precision, and it covers them but rarely, because most of those banks have not materially changed their holdings in decades. The US stockpile of 8,133 tonnes has been essentially unchanged since the 1970s.
The second base is stated purchases: central banks that announce their own buying. Poland's National Bank publishes its accumulation — 102 tonnes in 2025, the largest reported buyer for the second consecutive year. The People's Bank of China discloses monthly changes. The National Bank of Kazakhstan and others report through the IMF. Where stated purchases exist, they are primary evidence.
The third base — and here the dataset changes character — is estimated unreported buying. Some institutions accumulate gold without disclosure for years at a time. China is the canonical case: the PBoC increased its reported holdings by over 1,600 tonnes between 2009 and 2015 after years in which its last published figure had not changed, and has since reported with monthly regularity. No one knows how much undisclosed buying occurs in any given year, at any institution, including the possibility of accumulation that has never been reported at all. The estimates absorb this with modelling assumptions that cannot be independently audited from outside.
The fourth base is inferred absorption: the residual that official-sector buying must occupy for the global supply-and-demand balance to close, given estimates of mine output, recycling, jewellery demand, investment flows and industrial use. This is arithmetic on top of estimates — an estimate of the gap, not an observation of the buying.
The Q1 2026 revision illustrates what this architecture implies. The reclassification that moved 187 tonnes out of the central-bank category and into OTC-investment demand did not change any physical fact about the first quarter. It changed the classification of flows whose ownership was never directly observed in the first place. The same architecture cuts the other way: the 1,082 tonnes reported for 2022 could as easily have been 950 or 1,150, and the published record would have carried each with equal confidence at the time. The World Gold Council is transparent that its data are estimates and revises them openly — the Q1 2026 tables carry a note pointing readers to the reclassification — but the public conversation treats each vintage as fact while it is current.
The practical consequence is easy to state. Reported-position changes (the first two bases) support statements like "Poland bought 102 tonnes in 2025." Estimate-dependent aggregates support only statements like "estimated net official purchases in 2025 totalled 863 tonnes." The difference is not pedantry. In April 2026 the first formulation's analogue was wrong by a factor of four within a single quarter.
Measuring the unmeasurable: the record's revision history
The Q1 2026 revision is not an isolated incident; it is the most recent entry in a pattern that runs through the whole series, and assembling the pattern changes how the headline numbers should be read.
The 2022 record is the clearest precedent. On 31 January 2023, the World Gold Council published its Gold Demand Trends for full-year 2022 with central-bank demand of 1,136 tonnes — a record, widely reported as the fastest pace since 1967. Within the week, the figure was revised to 1,082 tonnes, with the FY2022 page carrying a revision note dated 7 February 2023; every subsequent World Gold Council publication has carried 1,082. The 54-tonne revision (under 5%) was small — but the record total that entered the historical canon, the one quoted in the survey's "1,000 tonnes a year" framing, is the revised number, and the original circulated for days at a level the publisher itself did not sustain. The Q1 2026 episode repeated the pattern at larger scale (244 → 57) and longer range (three months).
Both revisions share a signature: the initial print is an estimate built on incomplete reporting, and the revision arrives when better data — IMF IFS position updates, reclassifications, late filings — replaces part of the estimate. In the 2022 case the estimate was revised down slightly; in the 2026 case, down by three-quarters. Neither was a small rounding exercise, and there is no structural reason the next revision could not go upward. The honest description of any current-year figure in this series is a range with a published point estimate, not a fact of the same epistemic grade as reported holdings.
The opacity runs deeper than revision timing. Official gold flows are, in several key jurisdictions, deliberately unobserved. China's accumulation history is the largest example: between 2009 and mid-2015 the PBoC's reported holdings did not move while external evidence — import data through Hong Kong, refining flows, market commentary — indicated continuous buying; in July 2015 the bank disclosed a one-off jump of over 600 tonnes, revealing accumulation that had never been contemporaneously reported, on top of the roughly 450 tonnes its 2009 disclosure had revealed accumulated since 2003. The 2026 analogue is structural, not archival: the World Gold Council's own China updates, and official commentary reported by Reuters (a prominent PBoC-affiliated adviser publicly urging faster, larger accumulation), sit alongside a reported monthly series that shows steady but modest additions. Whether the reported series understates the true pace is unknowable from outside — which is precisely why the PBoC's August acceleration (about 20.2 tonnes, the largest monthly addition since October 2023) generated so much attention: the visible series is the lower bound of a distribution whose upper bound nobody can measure.
Three implications follow for anyone using these numbers.
First, headline stability is not data stability. The "1,000 tonnes a year" framing is a truth about the revised record, and the revised record is itself one plausible draw from an estimated distribution. The four-year totals, the cumulative 9,754 tonnes, and the absorption ratios in this report all carry that uncertainty, at a magnitude the World Gold Council does not formally publish.
Second, revisions are asymmetric in public memory. The initial 1,136-tonne print of 2022 and the initial 244-tonne print of Q1 2026 both travelled through market commentary, headlines and social media; the corrections travelled through specialist channels. A reader sampling the public record at random would come away with systematically inflated impressions of buying in the quarters that were later revised down.
Third, the measurement problem is itself informative about the market. The central bank is the only major demand segment in any commodity market whose purchases must be substantially inferred rather than observed. That inference exists because the buyers prefer not to be observed — opacity is a feature of the strategy, consistent with institutions accumulating an asset whose appeal, in the survey's own language, is precisely that it sits outside other governments' reach. The unmeasured portion of the dataset exists because the buyers have chosen that it should.
Reported-position changes (IMF IFS, PBoC monthly, NBP statements) are facts; current-quarter and current-year estimates are provisional; the World Gold Council's revisions surface in the following quarter's tables; and any single quarter below roughly 100 tonnes or above 300 tonnes warrants proportionate suspicion until the next vintage confirms it.
The record year: what changed in 2022
The three largest buying years in the recorded series are 2022, 2023 and 2024. The inflection is sudden enough to ask what changed, and the timeline supplies an answer that the participants themselves corroborate.
On 24 February 2022, Russia invaded Ukraine. Within days, a coalition of economies applied sanctions that froze approximately $300 billion of the Bank of Russia's foreign reserves — roughly half of Russia's $640 billion in total reserves, per IMF and Reuters reporting at the time. No institution holding reserves in the currencies and instruments of the sanctioning economies could afterwards treat those instruments as unquestionably accessible. The freeze had been theoretically discussable before; it had never been executed at scale against a G20 economy.
Official-sector gold purchases in 2022 ran to 1,082 tonnes — 55% above the 2021 level and the largest annual total in the series to that point. The World Gold Council's own commentary ties the surge to the geopolitical demonstration; its 2023 reporting described central banks relocating physical gold back to domestic vaults, and the Financial Times documented the repatriation wave that July: institutions buying physical bullion rather than derivatives or stored claims abroad, and moving existing holdings home.
Russia itself is the template the buyers appear to have studied. Between 2014 and 2020 — after the first sanctions episodes over Crimea and Ukraine — the Bank of Russia reduced the dollar's share of its reserves from roughly 40% to under 20% while accumulating gold relentlessly, reaching over 2,300 tonnes. When the freeze came, the portion of Russia's reserves held as gold inside its borders was the portion that remained usable. The demonstration was not lost on reserve managers elsewhere: the countries that have bought most aggressively since 2022 are, with the striking exception of Poland, predominantly emerging-market and middle-power economies with explicit reasons to hold reserves that no other government can immobilise.
Attribution requires care. No central bank has stated "we buy gold because we watched your freeze Russia's reserves" — the statement would be diplomatically self-incriminating. What exists is the survey record: the World Gold Council's 2026 survey of 76 institutions lists gold's performance during crises, portfolio diversification and inflation hedging as the leading motives for holding gold, with hedging against geopolitical risk prominent among reasons to increase allocations. The survey's own timing is informative — most responses arrived after the start of the Middle East conflict in February 2026, and the answers show elevated concern with accessibility.Motive in the reserve-management profession is self-reported and anonymous; the observable facts are the volumes, the timing relative to geopolitical events, and the physical relocation behaviour. All three point the same direction.
Who is buying
The buyer roster has a clear structure.
Poland is the era's most committed reported buyer. The National Bank of Poland was the largest purchaser in both 2024 and 2025 — 102 tonnes in 2025 alone — and led buying in the first quarter of 2026 with 31 tonnes. Its holdings reached 632.4 tonnes by the second quarter of 2026, having passed the European Central Bank's own gold (~507 tonnes) early in the year, and Governor Adam Glapiński has raised the institution's target to 700 tonnes — roughly a doubling since 2022 — alongside a long-run aim of gold at about 20% of Poland's total reserves. The accumulation is notable for the buyer's identity: a NATO member inside the European Union, buying gold not against the dollar system but as insurance closer to home — Poland borders the war the 2022 freeze inaugurated.
China is the era's largest single-economy accumulator whose buying is only partially visible. The PBoC's reported holdings reached 2,387 tonnes by end-August 2026 — passing Russia's 2,283 tonnes earlier in the year — after 22 consecutive monthly increases, at about 9% of China's reserves. The reported additions in 2026 run at roughly 80 tonnes through August, including the largest monthly increase since October 2023 in August itself (~20.2 tonnes). The reported figure is a floor, not a ceiling: China's history includes multi-year accumulation that was never disclosed contemporaneously, and the World Gold Council's China updates treat the true stockpile as materially uncertain.
Central and Eastern Europe forms a distinct cluster: Kazakhstan, Uzbekistan, Azerbaijan (whose SOFAZ sovereign fund both buys and sells), Hungary, the Czech Republic, Serbia and others have been persistent buyers through the decade — economies for which reserve accessibility against regional powers is a live concern rather than a theoretical one.
Turkey and India anchor the emerging-market cohort. Turkey is a frequent buyer and, notably, a frequent seller when domestic dynamics (lira stress, deposit-dollarisation) call for it. India has accumulated steadily to roughly 880 tonnes, repatriated gold from the Bank of England in 2024, and continues modest reported buying.
The advanced economies, for the most part, are absent from the buying ledger — and equally absent from the selling one. The US, Germany, Italy and France together hold about 16,374 tonnes, unchanged for decades, a strategic dormancy that has its own meaning: whatever the price does, the largest holders treat their gold as untouchable. Germany's repatriation — 674 tonnes moved from New York and Paris to Frankfurt between 2013 and 2017, completed three years ahead of schedule per the Bundesbank's own announcement — was the advanced-economy precursor of the post-2022 relocation behaviour now visible among emerging-market banks: not buying, not selling, but changing where the metal lives.
The Poland model: anatomy of the era's buyer
Poland deserves a closer look because it is the era in miniature — and the clearest test of whether the buying is strategic and durable or opportunistic and episodic.
The programme's architecture is unusual in being public. Most central banks do not announce reserve-composition targets; the National Bank of Poland's governor has repeatedly stated his gold target (most recently 700 tonnes, raised from ~550 during 2026), the aspiration that gold reach about 20% of total reserves, and the rationale: financial security for a frontline state. The purchases have been executed steadily rather than in lumps — 102 tonnes in 2025 spread across the year, roughly 82 tonnes in the first half of 2026, with the bank reported to have bought opportunistically into the spring price correction — and the physical metal has been brought largely to Warsaw, with vault capacity expanded specifically for the purpose.
The Polish case demonstrates three things the aggregate data cannot. First, that strategic buying is compatible with price opportunism — the bank accelerated purchases into weakness rather than suspending them at highs, which is precisely the behaviour the 2026 Q2 data show at system level. Second, that the buying is political-economy insurance rather than portfolio optimisation in the narrow sense: a 20% gold allocation would be difficult to justify on mean-variance grounds alone, and entirely straightforward to justify on frontier-state grounds. Third, that the programme creates its own constituency: a bank that has publicly committed to 700 tonnes has a stated reason to continue through price drawdowns, which is what the record shows it doing.
The nearest analogue in intent if not scale is the Czech National Bank, whose governor has set a target of 100 tonnes by 2028 from a base of about a dozen — the same frontier-adjacent logic, an EU and NATO member re-weighting toward the unfreezeable asset. If the Poland-and-Czech approach spreads further into the EU's eastern flank, the survey's 74%-expect-lower-dollar-share reading will have found its mechanism: not a rush out of dollar assets, but a slow scheduled re-weighting of increments by banks whose geography makes the argument for them.
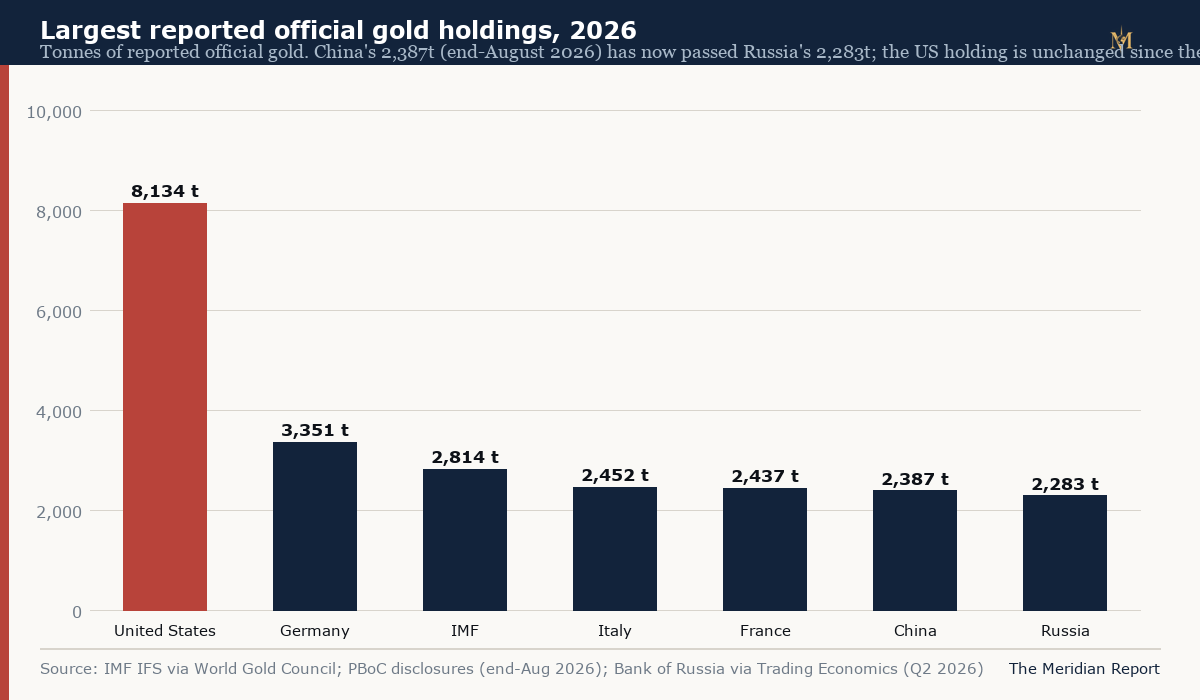
The sellers in the current record are few and specific. Russia reported sales in early 2026 — its first material drawdowns since the accumulation era, per Trading Economics' series showing holdings declining from about 2,305 to 2,283 tonnes across the first half — consistent with its use of reserves under sanctions. Turkey sells cyclically. Azerbaijan's SOFAZ increased reported sales in the first quarter. The World Gold Council's Q1 2026 report noted the uptick in sales explicitly and framed it as gold performing its role as "an accessible reserve asset during times of extreme market turbulence" — that is, selling is what the asset is for, on the banks' own account of it.
Price: record highs against a steady official bid
Gold's price performance across the buying era is the context that makes the volumes remarkable.
The LBMA annual average rose from $1,225 an ounce in 2010 to $1,801 in 2022, $2,386 in 2024 and $3,473 in 2025 — a 2025 calendar-year gain of about 65%, the strongest since 1979, in a year that set more than fifty daily record highs according to the World Gold Council's FY2025 review. The January 2026 peak reached approximately $5,602 an ounce before the price retraced to the $4,400 range by September — a drawdown of about 21% that, notably, did not coincide with any collapse in official buying: the second quarter of 2026, at 288.9 tonnes, was the strongest second quarter on record and landed largely during the price's steepest decline of the year.
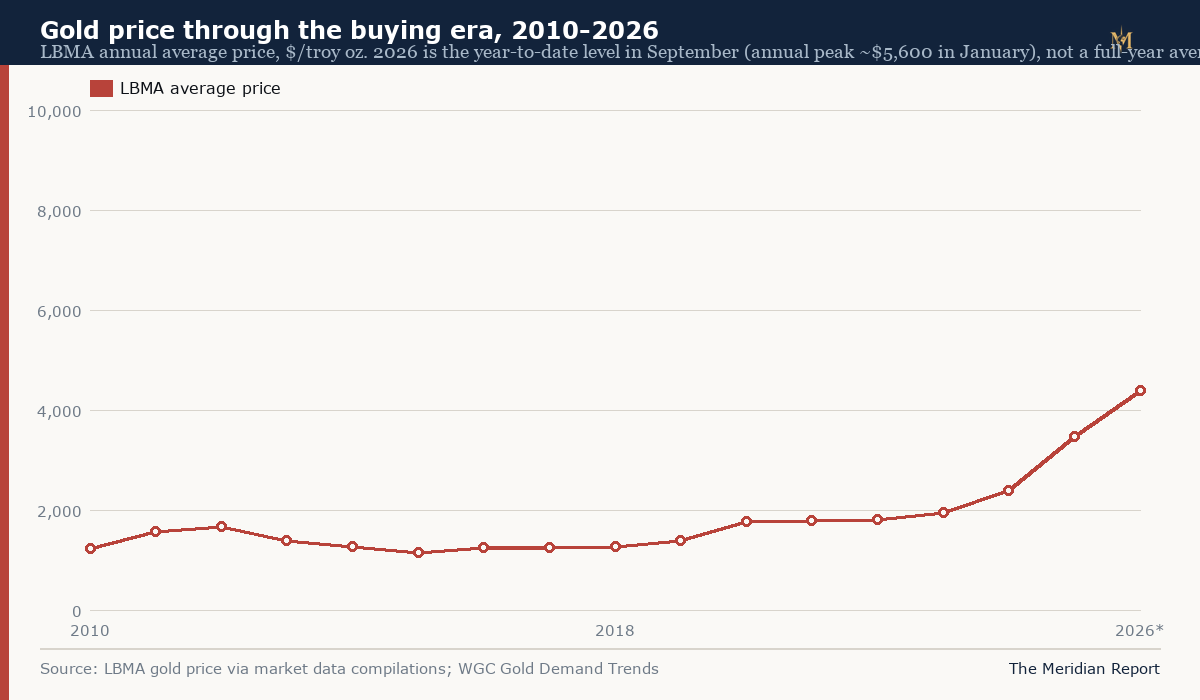
The combination — the largest sustained buying in the recorded series, at record prices, at a pace that survived a 21% drawdown — is the empirical core of the "price-insensitive buyer" framing that now dominates gold-market commentary. The case for the framing: a buyer that adds hundreds of tonnes a year regardless of price, and that holds through drawdowns, behaves unlike any marginal participant in the market. Price-insensitivity at scale is precisely what a strategic reserve accumulator looks like. The World Gold Council's 2025 commentary — that elevated valuations "appeared to prompt a more cautious approach" among some banks — describes hesitation at the margin, not retreat: 863 tonnes at record prices is not price-sensitive behaviour in any liquid-investor sense of the term.
The case against: the same 2025 data show the highest prices of the era coinciding with reduced volumes (down 21% year on year), and the first quarter of 2026 — revised — showed an outright slowdown plus increased reported sales amid price volatility. The relationship between price and official demand in this dataset is loose, and the direction of causation between flows and price cannot be established from public data. What can be said is what did not happen: there is no recorded year in the buying era in which high prices caused the official sector to become a net seller.
What this has done to reserve composition
The reserve-composition question is where the buying era meets the biggest interpretive stakes in international finance: is the dollar system being incrementally replaced?
The dollar's measured position: the IMF's COFER dataset, which tracks the currency composition of allocated foreign-exchange reserves, put the US dollar at 57.13% of allocated reserves in the first quarter of 2026 — up from 56.42% in the fourth quarter of 2025, with the IMF attributing roughly half of the quarterly increase to the dollar's appreciation against major currencies. The long arc is downward: above 70% around the turn of the century, 59% at end-2020 (a 25-year low at the time, per the IMF), 57.1% now. The decline across a quarter-century is real, gradual, and entirely consistent with the dollar remaining the dominant reserve asset by an order of magnitude over the euro (20.03% in Q1 2026) and every other currency. The renminbi — the currency most often proposed as the alternative — holds 1.99%.
Gold's measured position: estimates based on IMF and World Gold Council data put gold at roughly 24% of total official reserves at current prices — the largest single reserve component after the dollar's allocated-FX share, exceeding the euro's. In 2025, gold surpassed US Treasuries as a share of official reserves. That milestone travelled widely, usually with maximalist framing. The IMF's own data brief states the essential qualification: the 2025 development "was driven almost entirely by gold price valuation effects" — the existing stock revaluing upward — "and is not reflected in COFER's dollar share, which has remained broadly stable."
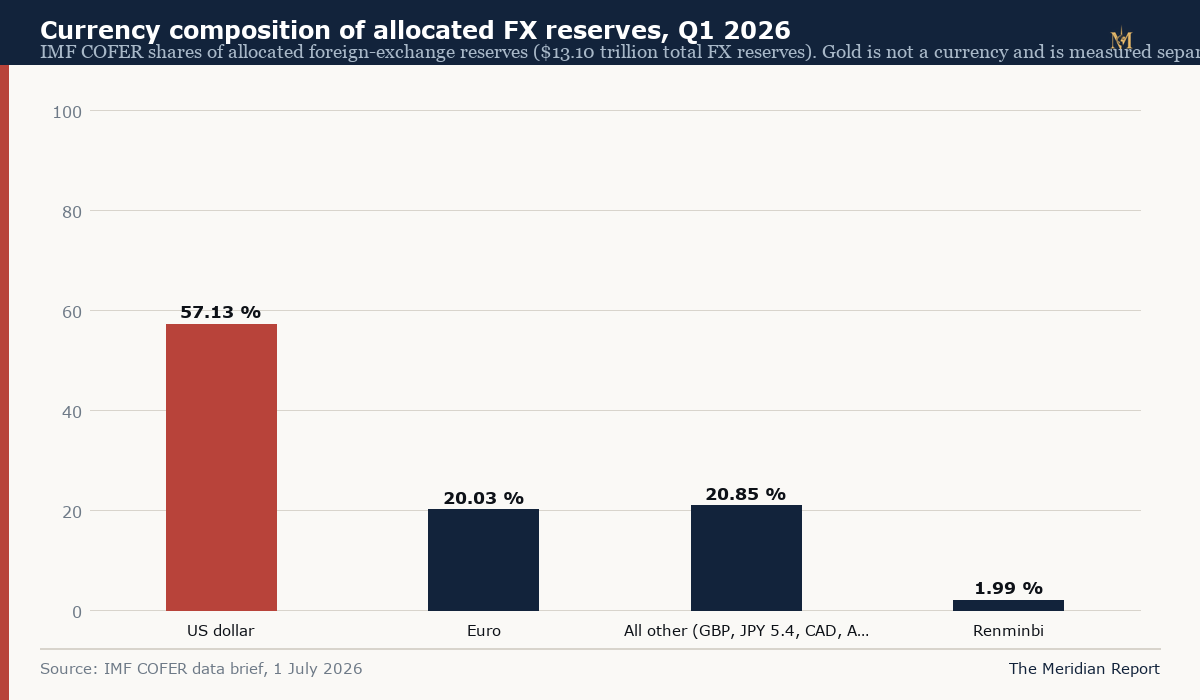
Two different things are happening in official reserves, and the IMF's data brief separates them precisely:
First, a flow fact: central banks have redirected a large share of their net new reserve accumulation toward gold for sixteen years, and at an elevated rate since 2022. This is established by the purchase record, within the measurement limits already described. The survey evidence — 95% of respondents expecting global official gold holdings to be the same or higher in twelve months, a record 45% expecting their own to rise, 74% expecting the dollar's share of global reserves to fall moderately or significantly over five years — corroborates intent at the institutional level.
Second, a stock fact: the dollar's share of the existing reserve base has declined gradually, has recently stabilised, and rose in the most recent quarter. Gold's share has risen — primarily because its price rose. A reserve manager who held gold passively since 2019 saw its share of their reserves triple without buying a gram.
The honest synthesis is narrower than either the "de-dollarization" headline or the "nothing is changing" rejoinder. The official sector is not abandoning the dollar — 57% of allocated reserves say so directly, and the marginal buyers report motives that include diversification and crisis performance rather than dollar replacement. But the official sector is conducting a large, persistent, price-tolerant re-weighting of incremental reserves toward an asset whose defining property, in the buyers' own survey language, is that it carries no counterparty and cannot be frozen. The gold era is a hedge against the dollar system being built inside the dollar system, not a successor to it. The distinction matters for forecasting: the first implies slow, steady, volume-driven accumulation as long as geopolitical incentives hold; the second would imply accelerating substitution — which the currency data do not show.
The physical market: what 900 tonnes a year means
Gold's physical market gives the official-sector flows a concrete meaning that financial flows lack: metal must come from somewhere.
Annual mine supply ran at 3,598-3,650 tonnes across 2024-2025 (3,671.6 tonnes of mine production in 2025, less producer de-hedging), with recycling adding roughly 1,365 tonnes. Official net purchases against that supply:
| Year | Official net purchases (t) | Mine production (t) | Official share of mine output |
|---|---|---|---|
| 2022 | 1,082 | ~3,612 | ~30% |
| 2023 | 1,037 | 3,644.4 | ~28% |
| 2024 | 1,092.4 | 3,650.4 | ~30% |
| 2025 | 863.3 | 3,671.6 | ~24% |
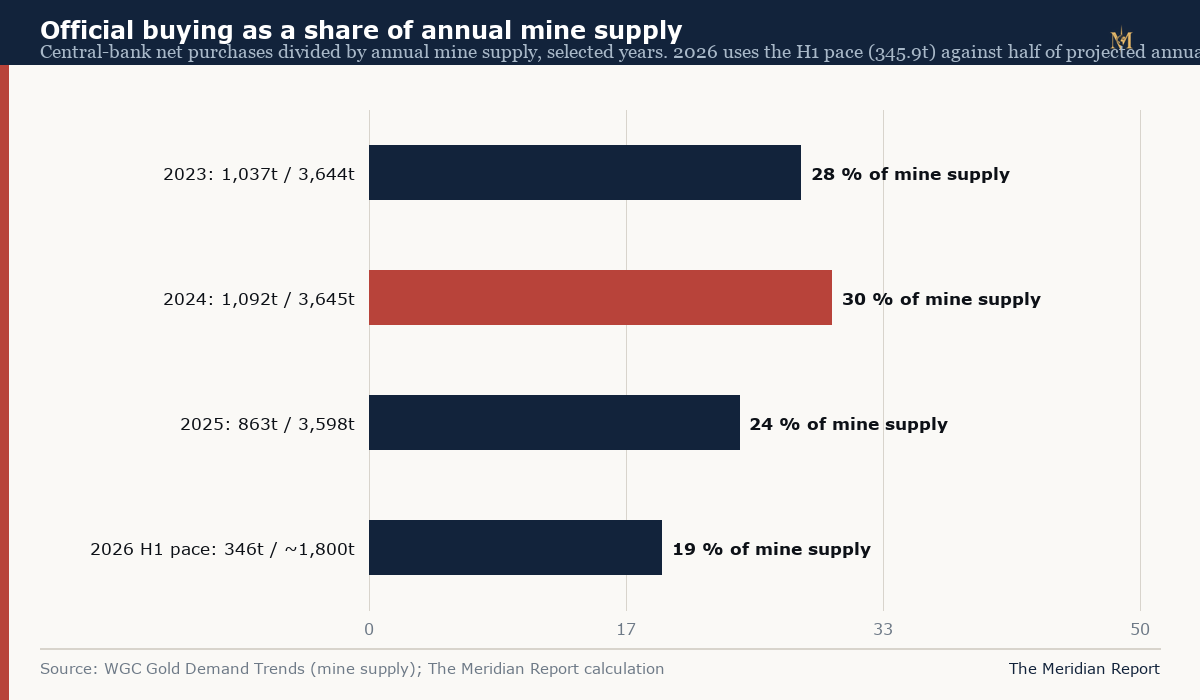
A buyer taking roughly a quarter to a third of the world's newly mined gold, every year, for three consecutive years, is not a marginal participant. The mechanical consequence — other things equal, a smaller share of mine output available to every other demand segment at any given price — is straightforward. The quantitative attribution of price levels to this flow, however, is beyond what public data establish: gold has no central price-setting mechanism, the investment segment (ETFs, OTC, futures positioning) moves more metal year to year than the official sector does, and 2025's ETF and investment dynamics, not the official bid, were the proximate swing factors in most published price decompositions. What the absorption arithmetic establishes is capacity: the official bid is large enough that its continuation at recent scale is a structural floor under demand, and its cessation would constitute a supply shock to every other segment. Both statements follow from the volumes; neither requires a causal-price claim.
The mine supply side adds a supply-constraint dimension worth stating precisely. Mine production has grown slowly — from roughly 3,560 tonnes in 2021 to 3,671.6 in 2025, per World Gold Council tables — because ore grades decline and new projects take a decade or more from discovery to output. The World Gold Council's FY2025 supply data show 2025's growth at well under 1%. A demand source that has grown from 473 to over 1,000 tonnes a year against a supply source growing by tens of tonnes a year is an arithmetically tightening balance, regardless of what any other demand segment does.
The paradox of the vaults: buying the escape asset, storing it inside the system
The survey's vaulting data contains the most under-reported fact in this subject. The Bank of England — the vault of the currency the buyers are diversifying away from — remains the most popular storage location among surveyed central banks, used by 57%. Domestic storage ranks second at 49%. The BIS ranks third at 16%, a modest rise on the prior year, while the Swiss National Bank's use as a vault fell from 12% to 6%.
Read against the geopolitical-hedging motive, the numbers look contradictory: institutions citing frozen-reserve risk as a reason to buy gold are leaving most of their gold in the financial system's traditional custody network. But the survey's own deltas resolve the apparent contradiction into something more precise: 9% of respondents increased domestic storage in the past 12 months and 10% diversified overseas storage locations, against 5% and 2% the year before — roughly double the previous year's movement, and mirrored in stated plans (7% and 9%). Vaulting behaviour is changing, from a low base and at the margin.
Two forces coexist, and the survey names them. The first is the structure the bullion market has run on for more than a century: London is where the liquidity is. Depth, market access, leasing, and the ability to transact large blocks quickly all run through the London clearing system and the Bank of England's nine underground vaults, which hold over 400,000 bars — the great majority on behalf of other central banks, per the LBMA. Moving the metal is expensive, slow and operationally risky; the LBMA noted that modern relocations involve 'physical logistical hurdles' and that the demand for London custody has if anything increased because of the buying era. The second is newer and geopolitical: post-2022, the accessibility of anything held inside the dollar/European custody network carries a tail risk that did not previously price. The FT's post-freeze reporting documented the resulting movement — institutions buying physical metal rather than paper claims and relocating holdings home — and the survey now quantifies its pace.
The accurate statement is therefore conditional: the escape asset is still stored inside the system, but the flow direction of storage has changed. The FY2025-era commentary that the metal being bought is increasingly being kept at home or in domestic vaults is supported at the margin; the stock of official gold in London remains dominated by legacy custody. Both facts will be visible in this dataset for years — the World Gold Council's annual vaulting question is now among the survey's most-watched outputs, and any acceleration of the home-storage trend would be one of the clearest observable signals of hardening de-risking from the dollar system.
What the gold market does with a buyer this size
The absorption arithmetic earlier in this report describes what official demand takes out of the market; this section describes how the market actually works around it, because the mechanics discipline what the flows can and cannot do to price.
London is the centre. The London bullion market operates through unallocated accounts — claims on a clearing member's pool of metal — and the London clearing system settles volumes of metal that dwarf daily mine production. Because most official-sector and investment demand transacts in London, most 'gold' traded daily is a claim, not a bar. The market's structure means official buying of 900 tonnes a year does not require 900 tonnes of newly mined physical delivery; it requires claims to be transferred and, as the vaulting data show, increasingly settled into allocated and sometimes domestic storage.
The claim structure is tightening at the margin. The system's stability condition is that unallocated claims stay within the tolerance of the bullion banking system's ability to source metal on demand. Three years of record official buying, rising Western ETF holdings through 2024-2025 after two years of outflows, and the survey's documented shift toward allocated and domestic storage all push in the same direction: demand for claims has grown while the share of participants wanting metal in specified, self-controlled form has risen. The 53 record-high days of 2025 and the January 2026 peak at about $5,602 occurred inside exactly this structure.
The counterparty dimension entered pricing after 2022. Where metal sits, and on whose books, became a live consideration for the first time in decades: the same tonnage held as an unallocated London claim, as an allocated bar in the Bank of England, or as a domestic-vault holding is not operationally the same asset once freeze risk is priced. The observable markers in the current data are the survey's storage shifts (9% moving storage domestically in twelve months, roughly double the prior year's rate), the FT-documented repatriation wave, and the persistent premium of strategic over tactical behaviour in the quarterly numbers. Market commentary through 2025-2026 has described delivery queues and physical-premium episodes during peak stress; those episodes are episodic and unevenly documented, and this report treats them as colour rather than data.
What the mechanics establish for interpretation is a boundary condition. The official bid's price influence operates through absorption: tonnes removed from the available pool tighten the balance against supply that grows by tens of tonnes a year. That is real and compounding. But the claim-based structure of the market means the price can also move — in either direction — on flows that never touch a bar: futures positioning, ETF creations and redemptions, and OTC trades among holders of claims. The 21% drawdown of early 2026, which occurred while official buying in the second quarter was setting its record, is the cleanest demonstration in the dataset that official absorption is a floor under the market, not a governor of it. Investors reading official purchases as a price guarantee are reading a flow that operates on years, in a market that prices in minutes.
2026: the bid meets volatility
The first half of 2026 provided the strongest live evidence yet on the question the whole record poses: what happens to official buying when the price becomes genuinely volatile?
The sequence: gold peaked near $5,600 in January, fell roughly 21% to the mid-$4,000s by spring, and the first quarter produced — after revision — the smallest quarterly official total since 2022 (57 tonnes), alongside increased reported sales from Turkey, Russia and SOFAZ. Some commentary read the quarter as the bid finally cracking.
The second quarter ran the other way: 288.9 tonnes, up 62% year on year, the strongest second quarter in the recorded series, led by Poland and China, with PBoC buying accelerating through the summer (its largest monthly addition since October 2023 in August) and a 22nd consecutive monthly increase. The buyers most committed to accumulation used the price decline to accumulate faster; the occasional and tactical sellers sold into weakness. That pattern — strategic buyers buying dips, tactical players trading — is what a maturing structural bid looks like, and it is directly observable in the quarterly data without appeal to motive.
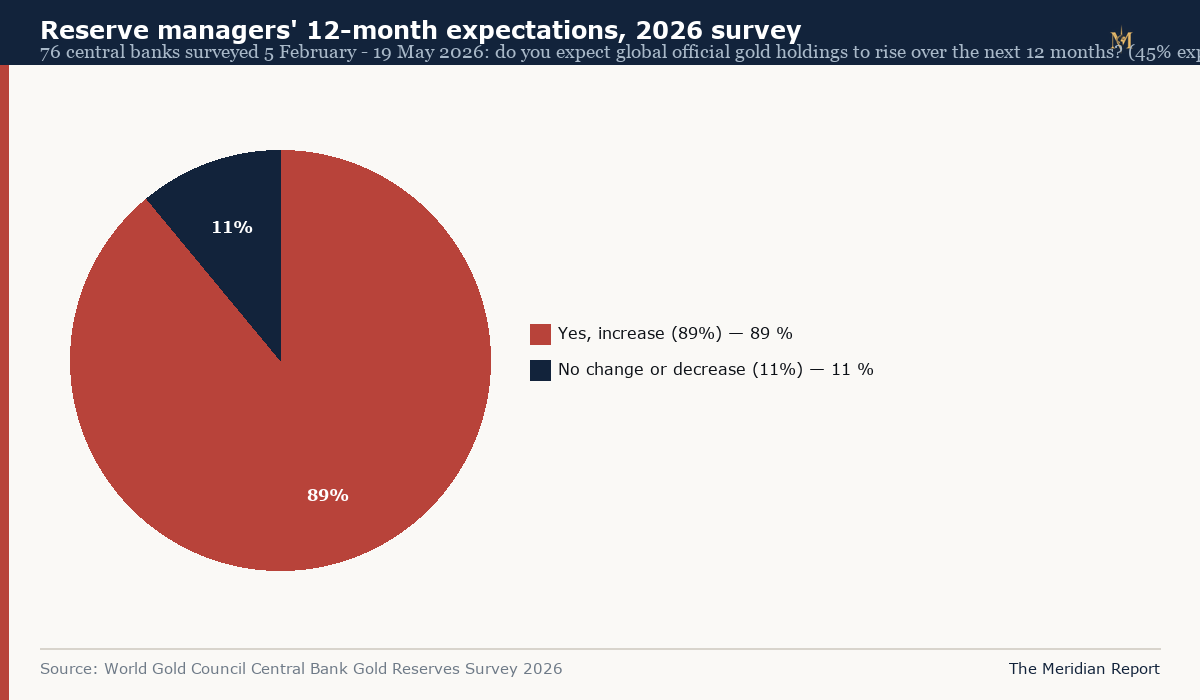
The survey adds the forward view, with its usual qualifications: 89% of 76 responding banks expect global official gold holdings to increase over the next twelve months — the most bullish reading in the survey's nine-year history — and the funding question produced the survey's most operationally revealing answer. Half of respondents intending to buy said they would fund purchases through a domestic-currency purchase programme; 38% said they would fund by selling existing reserve assets. The first answer describes new money entering gold; the second describes explicit substitution out of other reserve assets. Both are consistent with the re-weighting interpretation. Neither is consistent with a return to the pre-2010 era.
The selling era, 1989-2009: the record from the other side of the trade
The buying era's meaning is sharpened by the era that preceded it: the sellers of 1989-2009 executed the largest official liquidations in the modern record, and the price history that followed frames the current buyers' behaviour.
The centrepiece is the UK. Between July 1999 and March 2002, the Treasury sold approximately 395 tonnes of gold in seventeen auctions — roughly half of the UK's 715-tonne holding — at an average price of about $275 an ounce, per the Treasury's own retrospective account. The price was within sight of a two-decade low when the sales were announced; gold then began a two-decade advance that took it past twenty times the auction average at the 2026 peak. The episode remains among the most frequently cited decisions in modern reserve management, and the pattern extends across the era: the selling era's liquidations — the UK's, Switzerland's roughly 1,300 tonnes across 2000-2005, the coordinated programme the Washington Agreement of September 1999 was negotiated to orderly-manage — were executed near the generational price floor by institutions optimising for short-run portfolio logic.
The buyers of the current era have, in effect, priced that lesson in. Three features of the post-2010 behaviour distinguish it from the pre-2009 selling precisely where the selling went wrong. The buyers hold through drawdowns (the 2013 crash produced no official exodus; the 21% drawdown of early 2026 produced record Q2 buying). They publish targets and then exceed them (Poland's 700-tonne ceiling, raised as holdings approach it, inverts the 1999 sequencing: the target is announced first, and the accumulation follows it). And they treat the metal as a strategic position rather than a portfolio allocation — the difference between marking an asset to market and measuring a country's distance from the last financial cliff-edge. Whether the current buying proves as mistimed as the selling did is unknowable; what the record shows is that the two eras' participants learned opposite lessons from the same price history, and each acted accordingly.
What the gold is worth on the books: an arithmetic the US has not updated since 1973
One final computation puts the whole subject in unusual relief. The United States still carries its 8,133.5-tonne gold stock on the books at the statutory price of $42.22 an ounce — set in 1973, two years after the dollar's convertibility ended. The Federal Reserve's own international reserve statistics record the US gold stock at $11,041 million: eleven billion dollars, in a table published in 2026. (The $42.22 statutory price and its 1973 provenance are standard US Treasury accounting; the Fed table confirms the resulting book value.)
At the September 2026 market price of roughly $4,400 an ounce, the same 261.5 million ounces are mechanically worth about $1,150 billion. The gap between book value and market value on the world's largest official gold position is thus on the order of a hundredfold — an accounting artefact with real consequences. Several European central banks mark their gold to market, which is a large part of why gold's share of total official reserves (roughly 24%) has risen so sharply without new buying: the revaluation flows straight into reported reserve values. The US position, by contrast, is invisible to reserve-share arithmetic at its statutory price — and any American decision to mark the stock to market would, as a purely mechanical matter, credit the Treasury with roughly $1.1 trillion of asset revaluation without a dollar of new taxation or borrowing. Proposals along exactly these lines circulate periodically in US fiscal debates. This report makes no forecast of adoption; the arithmetic is stated because the book-versus-market gap is itself evidence of how far gold has travelled inside the system that nominally demonetised it — the reserve asset of last resort is carried at the price of a half-century ago, and its holder has no need to restate it.
The official sector's own institution: how the IMF sold gold into the buying era
One more actor completes the picture, because the boundary between the selling era and the buying era runs directly through the International Monetary Fund's own vaults.
On 18 September 2009, the IMF's Executive Board approved the sale of 403.3 metric tonnes of Fund gold — strictly limited to one-eighth of its holdings, and only to gold acquired after the Second Amendment of the Articles of Agreement — with proceeds directed to an investment endowment and concessional lending to low-income countries, per the Fund's own account of the programme. The execution is the revealing part. The modalities required the Fund to offer metal off-market to official-sector holders first, at market prices, before any on-market disposal. In October and November 2009 it sold 212 tonnes in exactly that way: to the Reserve Bank of India, the Bank of Mauritius and the Central Bank of Sri Lanka, followed by 10 tonnes to Bangladesh Bank in September 2010. The remainder was disposed of in phased on-market tranches explicitly designed not to add to announced official-sector sales, inside the 400-tonne annual ceilings of the final Central Bank Gold Agreement.
The India transaction became the buying era's founding emblem: a central bank of what would become one of the era's persistent buyers acquiring 200 tonnes — half the entire approved programme — in a single stroke, at market price, and the market's response was to mark gold higher rather than lower. The episode demonstrated two properties that the following fifteen years would repeatedly confirm: that official demand is large enough to absorb supply that would once have crushed price sentiment, and that the buying institutions treat announced accumulation as information to be published, not concealed.
The architectural endpoint matters too. The Central Bank Gold Agreement system — the Washington Agreement of September 1999 and its successors — had existed to manage European selling ceilings through three iterations. The final agreement expired in September 2014 and was not renewed: by then the disposals it had been negotiated to orderly-manage were complete, and the constraint had become moot. The institutional scaffolding of the selling era was dismantled at precisely the moment the buying era's survey data began to fill with emerging-market institutions. The Fund itself retains 2,814 tonnes — still the third-largest official holding, inside the roughly 36,700-tonne official-sector stock the World Gold Council estimated with the FY2023 data — and has sold nothing since. The symmetry is stark: the entire approved IMF programme, the largest coordinated official disposal of the era's start, amounted to 403 tonnes — under 5% of what the world's central banks have bought back in the years since.
Where the evidence settles
What is established: the official sector has been a net buyer every year since 2010; the accumulated purchases of 2010-2025 total roughly 9,754 tonnes on the World Gold Council's estimated series, with the 2022-2025 stretch averaging over 1,000 tonnes a year against a 473-tonne prior-decade average; the buying is concentrated in emerging-market and middle-power institutions with Poland as the largest reported and China as the largest partially-observed accumulator; official demand has absorbed roughly a quarter to a third of annual mine supply in the peak years; and the dataset's estimated component is subject to revisions large enough to change a quarter's reading by a factor of four.
What the evidence strongly suggests: the buying is strategic rather than opportunistic — it is public-targeted, price-tolerant, storage-conscious and correlated in timing with the demonstration that foreign-currency reserves can be frozen — and it functions as a persistent structural bid beneath the gold market rather than a price-setting mechanism.
What cannot be determined from public data: the true scale of unreported accumulation, the split of estimated official flows between genuine institutional buying and misclassified private demand, the counterfactual gold price without official buying, and the eventual size of the re-weighting.
What would change the picture: an advanced-economy liquidation (absent from the record for half a century), a China disclosure event in either direction, an official-sector net-selling year — none currently visible — or, on the supportive side, an acceleration of the home-vaulting trend that would confirm the hardening of the hedging interpretation.
The most compact statement the record supports is this: for sixteen years, the institutions that manage national savings against worst cases have been moving a steadily larger share of those savings into the one reserve asset that no other government can freeze, print or devalue on their behalf — slowly, unevenly, at prices they consider irrelevant, and in volumes large enough to redefine the gold market while remaining too small, so far, to redefine the dollar system they are hedging against.
Counter-evidence and its limits
A record this consequential warrants its strongest counter-case:
The revision risk is demonstrated, not hypothetical. One quarter in four was revised by 77% this year. The pre-2010 record's seller-era data were likewise built on estimated bases. Any statement built on the estimated component of the series inherits that fragility, including this report's cumulative 9,754 tonnes.
The valuation effect cuts both ways. If gold's reserve-share gain is mostly price, then a sustained price decline — the 21% drawdown of 2026 extended, say — would mechanically reverse gold's reserve-share gains without any bank selling a gram. The stock-based story of gold's rising importance is more fragile than the flow-based story.
The dollar data resist the dramatic reading. 57.13% and rising in the latest quarter; the euro flat; the renminbi immaterial. Whatever is happening at the margin, the centre of the reserve system has not moved.
Sales are reappearing. Russia — the era's template buyer — sold in the first half of 2026 under duress. Turkey and SOFAZ sold tactically. The 1989-2009 seller era began with advanced-economy liquidation; today's sellers are emerging-market and stress-driven, but the data show the selling side of the ledger is not empty.
Price sensitivity exists. The World Gold Council's own 2025 commentary attributes reduced buying to elevated valuations. The bid is price-tolerant, not price-blind; at $5,600 the marginal bank hesitated.
The buyer base is concentrated. Poland, China and a handful of Central Asian and Middle Eastern banks account for a large share of reported buying. Concentrated buying is easier to slow than diffuse buying: a change of policy in Warsaw or Beijing moves the reported series by itself.
None of this reverses the record. All of it constrains what the record proves.
Three paths from here
Continuation. If geopolitical fragmentation persists at current intensity and no major holder reverses, the official sector continues absorbing 700-1,000 tonnes a year against mine supply growing marginally. The observable signatures: quarterly prints above 150 tonnes, the survey's bullish majority holding or widening, PBoC streaks extending, Poland continuing as anchor buyer. The reserve consequence compounds slowly — gold's share rising through both flows and price, the dollar's share eroding fractionally.
Valuation stall. If the price retrace deepens and holds, the 2025 pattern repeats in stronger form: volumes sag toward the 400-600 tonne range, tactical selling broadens, but strategic buyers (Poland, China, the Central Asian cluster) keep the official sector a substantial net buyer. Gold's reserve share drifts down with price; the flow story continues at reduced scale. The signature: quarterly prints below 100 tonnes with no change in survey intent.
Reversal. A genuine seller era would require the advanced-economy stockpiles to move — a US or eurozone decision to liquidate, or a funding crisis forcing sales at scale. Nothing in the current record shows this; the 8,133-tonne US position has been static for half a century through every price regime. The nearer-term reversal risk is concentrated-buyer fatigue: a China disclosure pause, a Polish target reached, an emerging-market balance-of-payments squeeze. The signature for genuine reversal: net official sales in a full year, which has not occurred since 2009, and would be visible in the IMF IFS reported-position data before any estimate confirmed it.
Limitations
The estimates are the load-bearing limitation. This report's cumulative tonnage (9,754), its dollar valuations, and its absorption ratios all depend on the World Gold Council/Metals Focus estimated series, whose revision behaviour was demonstrated this year. Reported-position data (Poland, China, Russia, IMF IFS) are the strongest links; the inferred-absorption component is the weakest, and the 2022-2024 figures carry the largest estimated component of the series.
A related structural point deserves its own statement: the flow side of this report is effectively single-sourced. The World Gold Council (through its consultancy relationship with Metals Focus) is the only institution producing a continuous, public, quarterly estimate of official-sector net purchases; no independent compiler publishes a comparable series with a different methodology whose agreement or disagreement could be checked. Independent partial cross-checks exist — IMF IFS reported positions, the LBMA clearing and vaulting observations, mining companies' own customer disclosures — but none reproduces the headline flow aggregate. Every figure in this report that depends on the estimated series therefore inherits a single point of failure in methodology, however carefully the compiler revises. Cross-source agreement on reported positions is one grade of corroboration; the absence of any alternative flow estimate is a different and weaker one.
China's reported figure is a floor with an unknown ceiling. Statements about Chinese holdings (including this report's 2,387 tonnes) describe what the PBoC reports, not necessarily what it holds; the 2009-2015 precedent of unreported accumulation is documented, and no public method exists to bound the gap.
Price data are averages, not transaction records. The dollar valuations use LBMA annual averages; the actual purchase prices of the era's tonnage differ, institution by institution, quarter by quarter. The three valuation framings in this report ($520bn cost-basis-scale, $1.09 trillion at 2025 average, $1.38 trillion at September 2026 spot) are mechanical conversions, not accounting of any actual portfolio.
Motive evidence is survey-based and anonymous. The crisis-hedging interpretation of the 2022 inflection rests on timing, the survey's stated motives, and observable relocation behaviour — not on any institution's public attribution. The reserve-composition conclusion (hedging within the system, not replacement of it) is an interpretation supported by the flow and stock data as presented; a future in which currency shares shift faster than the last decade's trend would supersede it.
The 2026 picture is incomplete by construction: two revised quarters, one reported month of July data, and no third-quarter publication at the time of writing (19 September 2026).
Method
Annual official-sector net purchases 2010-2025 are the World Gold Council's Gold Demand Trends series as published across the FY2025, Q1 2026 and Q2 2026 editions; the 2010-2021 annual figures are as carried in the World Gold Council's historical dataset, used by the survey for its 473-tonne decade average. Cumulative tonnage, four-year averages, and absorption ratios are this report's summations of those series; the 473-tonne and 1,000-tonne cross-checks reproduce the World Gold Council's own published aggregates from the component years. Mine production figures (3,644.4t in 2023; 3,650.4t in 2024; 3,671.6t in 2025; ~3,612t in 2022) are from the Gold Demand Trends supply chapters. Dollar valuations convert tonnes at 32,150.7 troy ounces per tonne and apply the stated LBMA price reference (2025 average $3,473; September 2026 ~$4,400; era-average $1,664 computed from the 2010-2025 annual averages in this report's price series). Currency shares are IMF COFER (Q1 2026 data brief, 1 July 2026); gold's total-reserve share (~24%) is the IMF/World Gold Council-based estimate as reported in market analysis. China holdings are PBoC disclosures via the World Gold Council's China gold market update (September 2026); Russia holdings are Bank of Russia data via Trading Economics (Q2 2026). Survey figures are from the Central Bank Gold Reserves Survey 2026 (76 respondents, fielded 5 February - 19 May 2026). The Q1 2026 revision (244t → 57t) is documented in the Q2 2026 Gold Demand Trends' central-banks chapter. Where a figure is an estimate subject to revision, the text says so.
Appendix: the dataset's own revision, in full
The full sequence of the year's most consequential data event: the World Gold Council's Q1 2026 Gold Demand Trends (29 April 2026) reported central-bank net purchases of 244 tonnes, up 17% quarter on quarter, led by Poland (31t) and Uzbekistan (25t), with increased reported sales from Turkey, Russia and SOFAZ. Its Q2 2026 edition (30 July 2026) disclosed that new data and analysis "led to a sizable revision to our Q1 central bank demand estimate from 244t to 57t," including a reclassification of flows from central banks to the OTC investment category, and carries the revised figure in its quarterly table alongside the Q1 2025 comparator of 237.0 tonnes. Both editions remain available unamended; the organisation's practice is to publish revisions transparently rather than silently restate. The April figure travelled widely; the July correction did not. Any citation of official-sector demand for Q1 2026 should use the revised 57 tonnes.
| Measure | Value | Basis |
|---|---|---|
| Cumulative official net purchases, 2010-2025 | 9,754 t | Sum of WGC annual series (this report's reconstruction) |
| Four-year total, 2022-2025 | 4,074.7 t | WGC series sum (avg 1,019 t/yr; WGC survey states "average of 1,000t") |
| Decade average, 2010-2021 | 473 t/yr | WGC survey; reproduced from series |
| Largest reported buyer, 2024 and 2025 | National Bank of Poland (102 t in 2025) | WGC GDT FY2025 |
| Q2 2026 net purchases | 288.9 t (+62% y/y) | WGC GDT Q2 2026 |
| Q1 2026 net purchases (revised) | 57 t (initially 244 t) | WGC GDT Q2 2026 revision note |
| China reported holdings, end-Aug 2026 | 2,387 t (22nd consecutive monthly rise; ~9% of reserves) | PBoC via WGC China update |
| Russia reported holdings, Q2 2026 | ~2,283 t (declining) | Bank of Russia via Trading Economics |
| US reported holdings | 8,134 t (unchanged since the 1970s) | IMF IFS via WGC |
| 2025 LBMA average price | $3,473/oz (+~65% y/y, strongest since 1979) | LBMA via market data |
| January 2026 record high | ~$5,602/oz (28 January 2026) | Market data (APMEX; GoldSilver corroboration) |
| Official share of mine output, 2024 | ~30% (1,092.4t / 3,650.4t) | WGC GDT supply tables; this report's calculation |
| Official share of mine output, 2025 | ~24% (863.3t / 3,671.6t) | WGC GDT supply tables; this report's calculation |
| USD share of allocated FX reserves, Q1 2026 | 57.13% (from 56.42% in Q4 2025) | IMF COFER |
| EUR / RMB shares, Q1 2026 | 20.03% / 1.99% | IMF COFER |
| Gold share of total official reserves | ~24% (estimate at current prices) | IMF/WGC-based market estimates |
| Gold vs US Treasuries as reserve share | Gold surpassed Treasuries in 2025 — "driven almost entirely by gold price valuation effects" | IMF data brief, 1 July 2026 |
| Survey: expect global gold reserves to rise in 12 months | 89% of 76 banks | WGC CBGR Survey 2026 |
| Survey: expect own reserves to rise | 45% (survey record) | WGC CBGR Survey 2026 |
| Survey: expect lower USD share of global reserves within 5 years | 74% | WGC CBGR Survey 2026 |
| Survey: funding for new purchases | 50% domestic purchase programme; 38% selling existing reserve assets | WGC CBGR Survey 2026 |